
Figures & data
Figure 1. Key steps for sustainability reporting. Source: Deloitte (Citation2021).
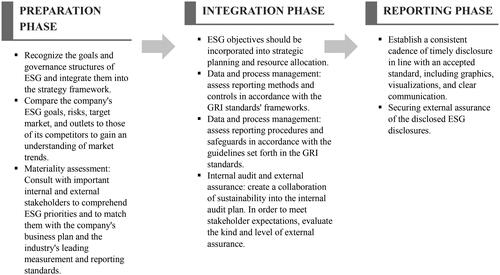
Table 1. Main variations between the GRI and SASB.
Table 2. Inclusion and exclusion criteria.
Table 3. Searching algorithm.
Table 4. Quality assessment checklist.
Figure 2. Distribution of Selected Publication Based on Year of Publication. Source: Own construction based on literature review method.
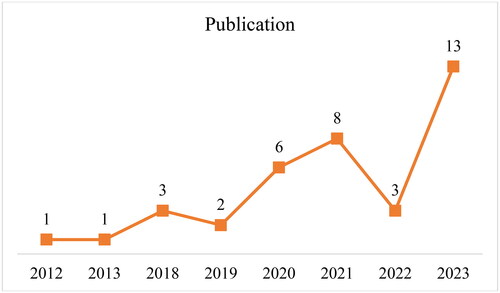
Table 5. Distribution of Selected Publications from Journals and Conferences
Table 6. Financial barriers of sustainability reporting for SMEs.
Table 7. General attitude barriers to sustainability reporting for SMEs.
Table 8. Knowledge and technology barriers to sustainability reporting for SMEs.
Table 9. Organizational barriers to sustainability reporting for SMEs.
Table 10. Policies and regulation barriers to sustainability reporting for SMEs.
Table 11. Policies and regulation barriers to sustainability reporting for SMEs.
Data availability statement
Upon a reasonable request, the information and materials that support the conclusions of this article will be given.
