
Figures & data
Table 1. Basic differences between accruals-based earnings management and real earnings management.
Figure 1. Processing of document eligibility based on the PRISMA guideline. Source: Created by the author from https://doi.org/10.7910/DVN/IA9LP1.
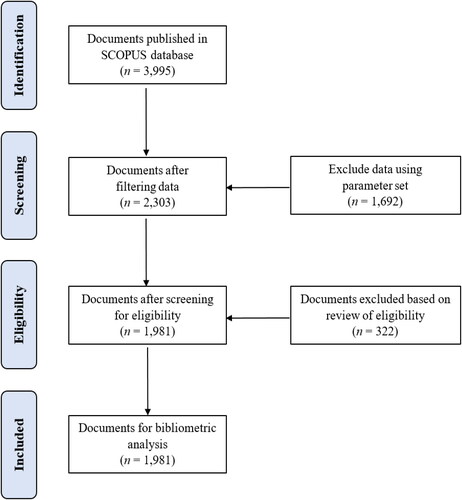
Figure 2. Number of publications related to earnings management during 1993–2021. Source: Created by the author.
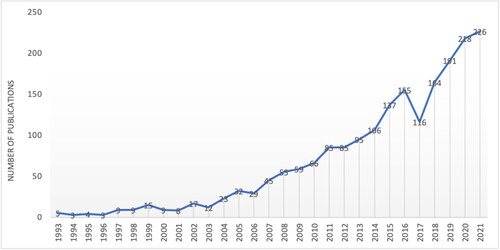
Table 2. Key authors by citations and numbers of publications.
Table 3. Most influential papers by citations.
Table 4. Leading countries by documents and citations.
Table 5. The top 10 contributing institutions by citations.
Figure 3. Science mapping of documents related to earnings management based on bibliographic coupling analysis between 1993 and 2021.Source: Extracted from VOSViewer with data from https://doi.org/10.7910/DVN/IA9LP1.
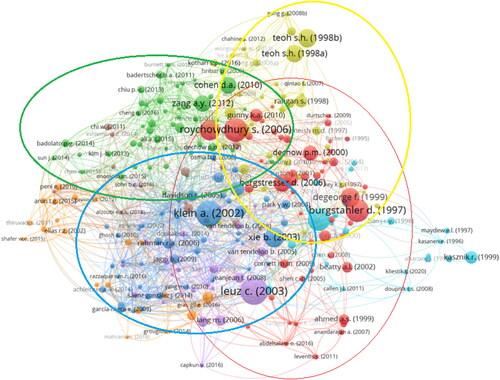
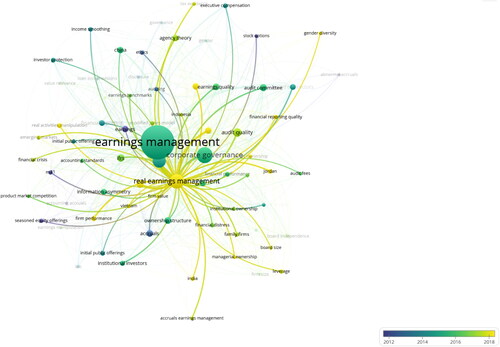
Figure 4. Keyword co-occurrence network map of various keywords. Source: Extracted from VOSViewer.
Data availability statement
The data that support the findings of this study are openly available at https://doi.org/10.7910/DVN/IA9LP1, Harvard Dataverse, V1, UNF:6:BDdjklqAgU6RPseEN + 6/DA== [fileUNF].
