
Figures & data
Figure 1. Conceptual framework of the study.
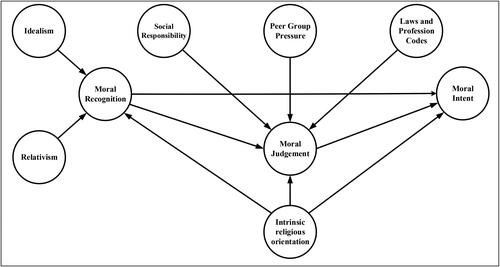
Table 1. Response rate and demographic information.
Table 2. Measurement and operationalization.
Table 3. Descriptive statistics.
Table 4. Indicators loading and reliability.
Table 5. Average variance extracted (AVE).
Table 6. Fornell and Larcker criterion and the heterotrait-monotrait (HTMT) ratio.
Figure 2. PLS-SEM results for vignette 1.
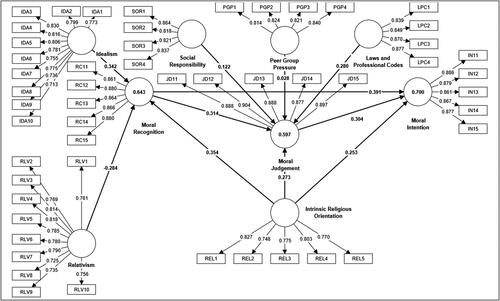
Table 7. Variance inflation factor (VIF).
Table 8. Results of the structural model.
Table 9. Direct relationships (hypotheses).
Table 10. Mediation analysis.
Data availability
The study’s data are available at https://doi.org/10.17632/zwwf46dydh.1.
