
Figures & data
Table 1. Theoretical framework of the study.
Figure 1. A conceptual scheme of events and information availability in the failure process. Note: The lighter green colour indicates a reduction in the predictive value of the earlier payment behaviour variables.
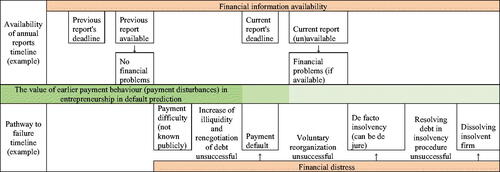
Table 2. Variables of the study.
Table 3. Descriptive statistics by the status of firms.
Table 4. Average marginal effects from the logistic regression analysis by single payment behaviour variables for different firm populations.
Table 5. Accuracies from the logistic regression analysis with single payment behaviour variables for different firm populations.
Table 6. Accuracies by two types of variables and both combined with three different prediction methods.
Table 7. Study’s results and their theoretical essence.
Data availability statement
Data not available due to legal restrictions.
