
Figures & data
Figure 1. Conceptual framework. Source: Data, researcher (2023).
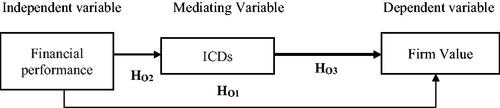
Table 1. Sample selection and industry cluster.
Table 2. Skewness/Kurtosis tests for normality.
Table 3. Breusch-Pagan/Cook–Weisberg test for heteroskedasticity.
Table 4. Wooldridge test for autocorrelation in panel data.
Table 5. Ramsey RESET test using powers of the fitted values of firm value.
Table 6. Descriptive statistics.
Table 7. Correlation matrix between variables and VIF values.
Table 8. Financial performance, intellectual capital disclosure and firm value.
Table A1. Intellectual capital coding framework.
Data availability statement
The data that support the findings of this study are available from the corresponding author, upon reasonable request.
