
Figures & data
Table 1. Profiles of sample green manufacturing companies (n = 187).
Table 2. Frequency distribution in SMA applications.
Table 3. Descriptive statistics.
Table 4. Pearson’s parametric correlation coefficients.
Table 5. Scale items and latent variable evaluation.
Table 6. Measurement model validity.
Figure 1. Results for the structural equation model.
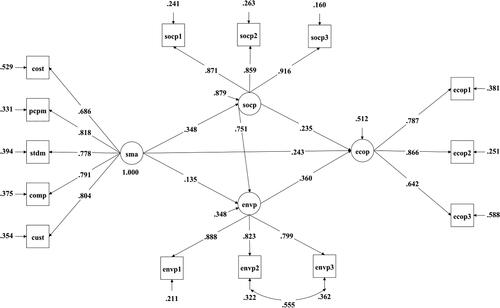
Table 7. Descriptive measures of overall model fit.
Table 8. Hypothesis testing results from structural equation modeling.
Supplemental material
