
Figures & data
Figure 1. Proposed research model.
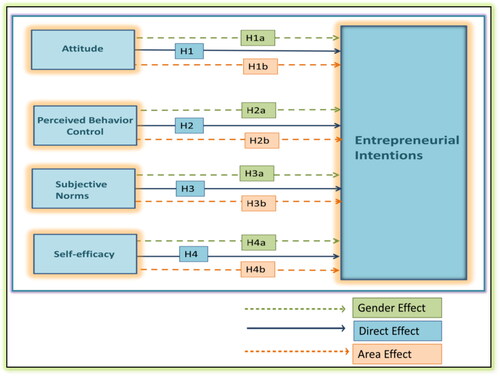
Table 1. Profile of respondents.
Table 2. Constructs reliability and validity.
Table 3. Fornell-Larckers criterion and HTMT ratio.
Figure 2. Structural model.
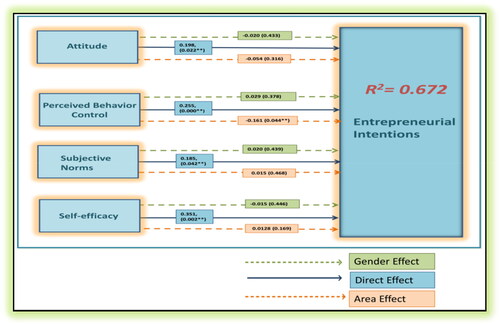
Table 4. Model fit results.
Table 5. Results of hypotheses.
Table 6. Multi-group hypothesis testing (gender).
Table 7. Multi-group hypothesis testing (area).
Figure 3. IPMA results.
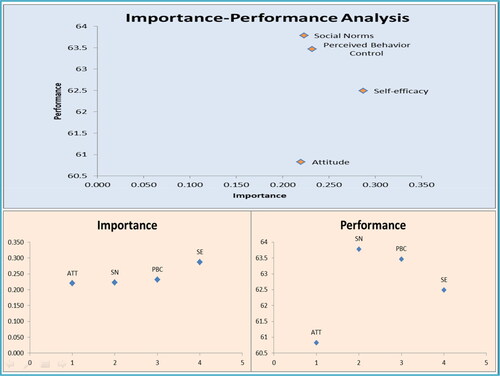
Table 8. PLS predict results.
Figure 4. PLS-SEM and ANN normalized importance.
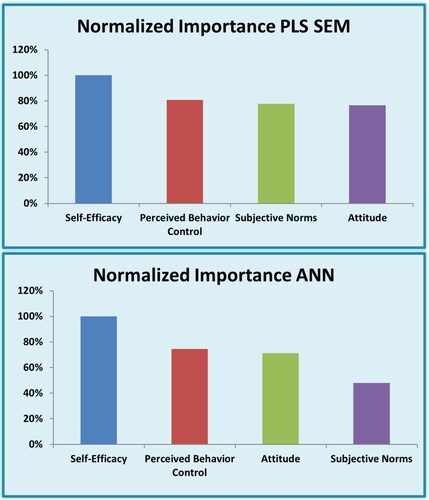
Table 9. ANN- RMSE results.
Figure 5. ANN model.
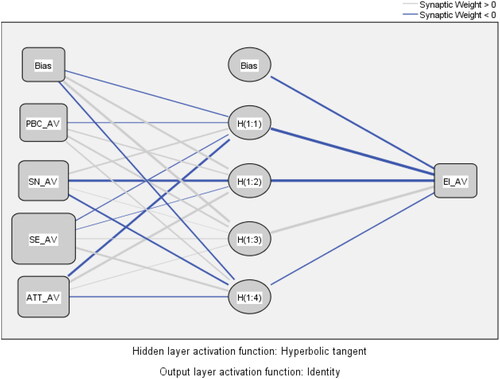
Table 10. Sensitivity analysis.
Supplemental material
