
Figures & data
Figure 1. Research model. Source: Authors’ creation (2023).
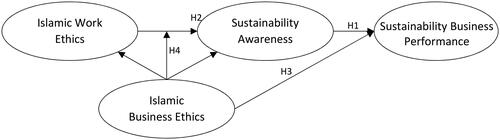
Table 1. Operational definition of variables.
Table 2. Respondent demographic.
Table 3. Quality of the measurement models.
Table 4. Hypotheses testing, result of path coefficient, and indirect effect.
Table 5. R-square results.
