Figures & data
Figure 1. The average percentage of US-China import tariffs.
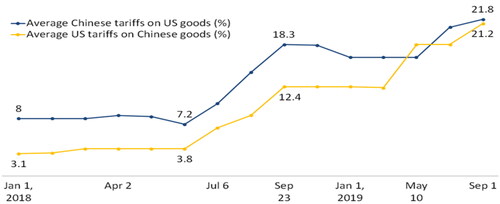
Figure 2. Effect of tariffs on imports.
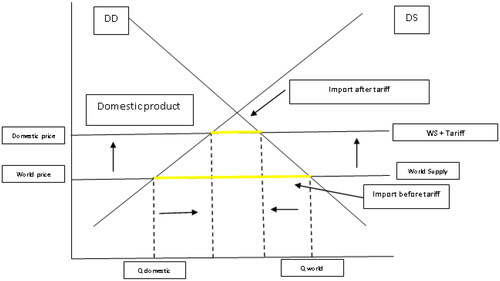
Table 1. Concentration level.
Table 2. Classification of Herfindahl–Hirschman Index (HHI) values.
Figure 3. Trade balance of Vietnam, Indonesia, Malaysia, Singapore, Thailand 2011–2020 Source: Data extracted and processed from Trademap https://www.trademap.org/.
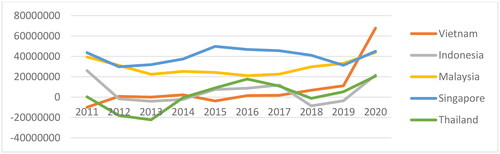
Table 3. Analysis results of C5 ASEAN trading partner countries.
Figure 4. China’s BoT to the US and China’s BoT to the World.
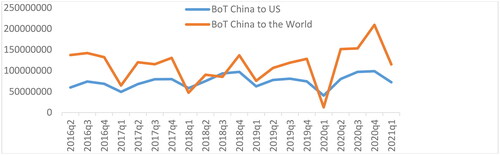
Figure 5. US BoT to China and the World, 2016q2–2021q1.
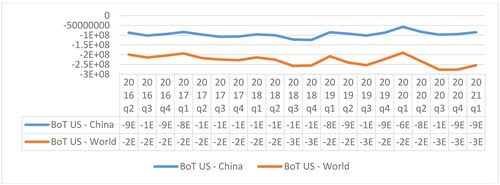
Figure 6. US BoT 2011–2020, Source: Trademap (2021).
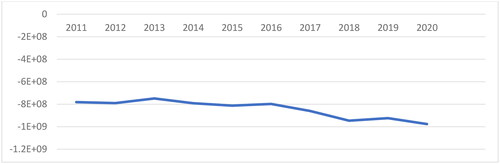
Figure 7. US exports and imports to China, PR 2001–2020.
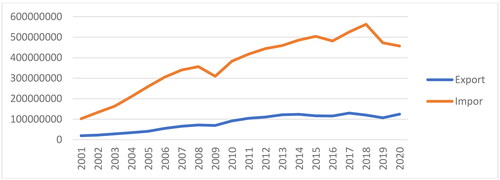
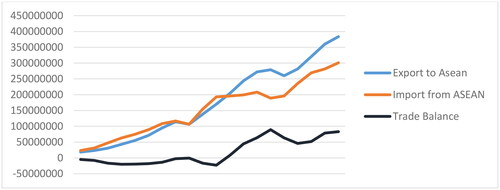
Figure 8. US BoT against ASEAN and 5 ASEAN Countries 2001–2020.
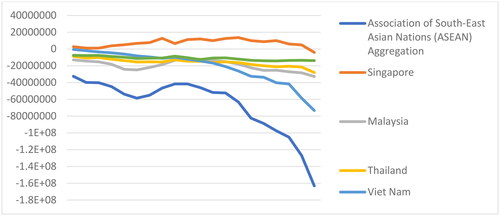
Figure 9. US BoT against ASEAN and 5 ASEAN Countries 2001–2020.
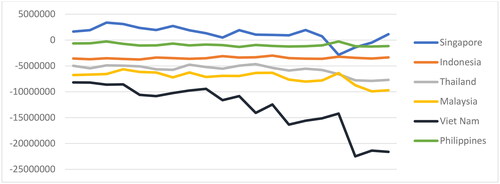
Figure 10. China’s trade performance towards ASEAN in 2001–2020.