
Figures & data
Figure 1. Conceptual framework of the study.
Source: Adapted from previous literatures (Jiang et al., Citation2023; Liu et al., Citation2019; Rosdaniati & Muafi, Citation2021).
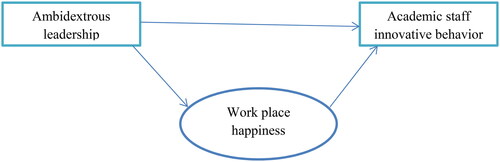
Table 1. Summary of the population and sample of the study.
Table 2. Demographic characteristics of respondents.
Table 3. Reliability and validity test results.
Table 4. Correlation table.
Table 5. Goodness of model fit results.
Figure 2. Structural model.
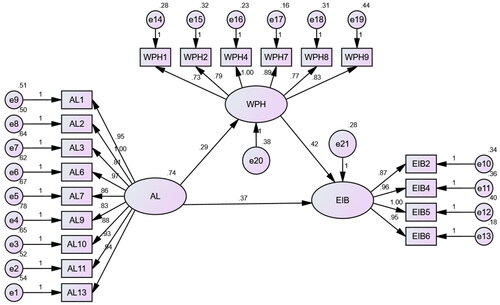
Table 6. Hypotheses testing results summary.
