
Figures & data
Table 1. Theories and previous studies review.
Figure 1. Model of conceptual factors affecting the development of transportation and spillover effects on neighboring provinces.
Source: Study result of authors.
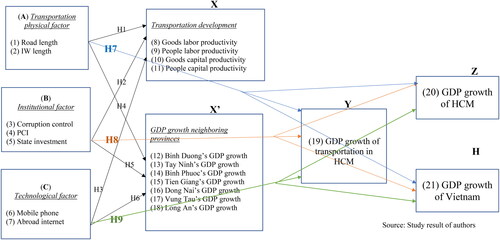
Table 2. Variables explanation in conceptual model.
Figure 2. Data collection and data processing procedure.
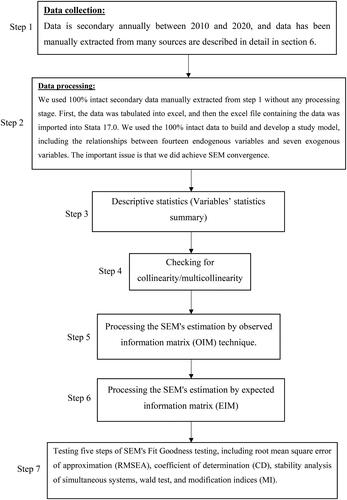
Table 3. Variables’ statistics summary.
Table 4. Kaiser-Meyer-Olkin (KMO) analysis results.
Table 5. Collinearity or Multicollinearity.
Figure 3. Depiction of the Structural Equation Modeling (SEM) estimation illustrating factors influencing the development of transportation and spillover effects on neighboring provinces. comprises five detailed SEM estimates, denoted as figures 3.1, 3.2, 3.3, 3.4, and 3.5.
Source: Study result of authors.
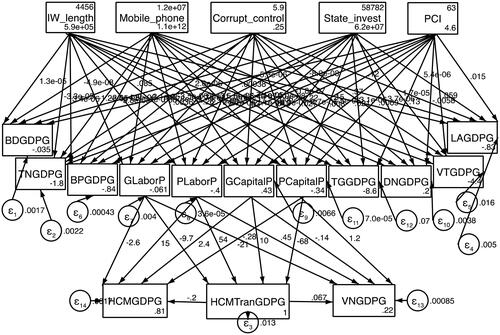
Figure 3.1. Depiction of the Structural Equation Modeling (SEM) estimation of the IW_length (inland waterway length) factor, illustrating its influence on the development of transportation and spillover effects on neighboring provinces.
Source: Study result of authors.
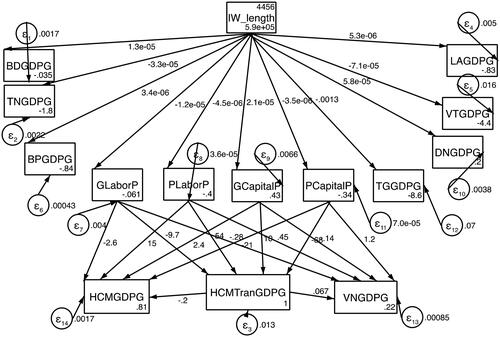
Figure 3.2. Depiction of the Structural Equation Modeling (SEM) estimation of the mobile_phone factor (total number of mobile network subscriptions), illustrating its influence on the development of transportation and spillover effects on neighboring provinces.
Source: Study result of authors.
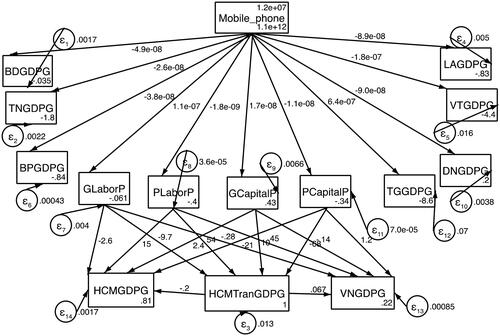
Figure 3.3. Depiction of Structural Equation Modeling (SEM) estimation of the corrupt_control factor (corruption control), illustrating its influence on the development of transportation and spillover effects on neighboring provinces.
Source: Study result of authors.
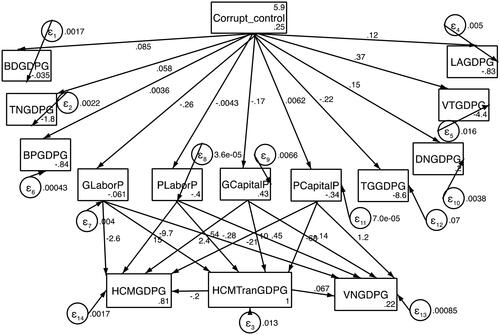
Figure 3.4. Depiction of the Structural Equation Modeling (SEM) estimation of the state_invest factor (investment from state capital in HCM), illustrating its influence on the development of transportation and spillover effects on neighboring provinces.
Source: Study result of authors.
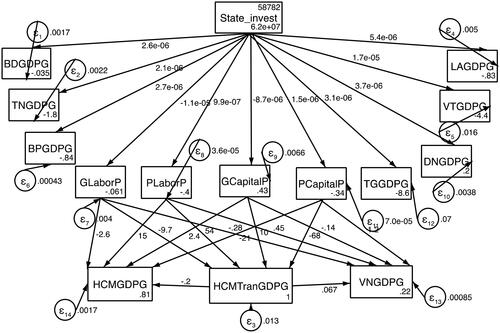
Figure 3.5. Depiction of the Structural Equation Modeling (SEM) estimation of the PCI factor (Provincial Competitiveness Index), illustrating its influence on the development of transportation and spillover effects on neighboring provinces.
Source: Study result of authors.
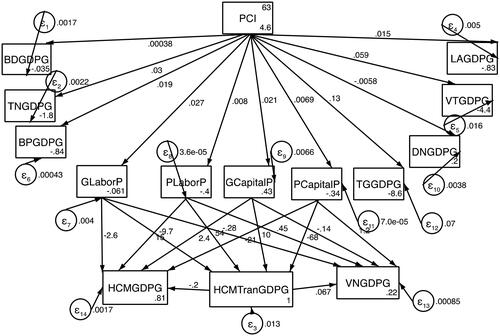
Table 6. RMSEA test result.
Table 7. Wald test result.
