
Figures & data
Figure 1. SME perspectives on marketing performance in business statistics.
Source: Pre-Survey, 2022.
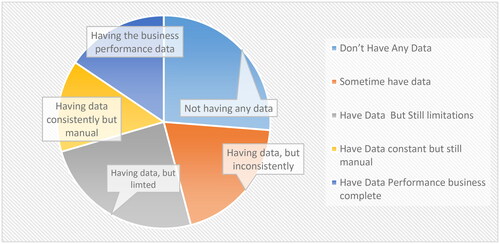
Table 1. The MSME criteria in Indonesia.
Table 2. Number of businesses and traders in Malang municipality in 2018–2020.
Figure 2. Annual scientific production.
Source: Bibliometric Analysis with Scopus Data (1959–2022), R Program.
Retrieved 19 October 2022, at 14:31.
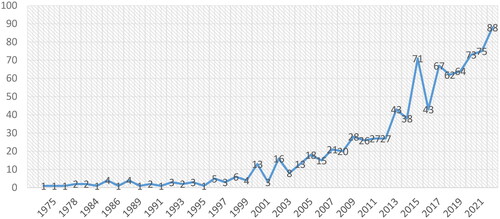
Table 3. The expanding domain of marketing performance measurement.
Table 4. Dimensions of marketing performance.
Figure 3. Thematic map.
Source: Bibliometric analysis with scopus data (1959–2022).
Retrieved 19 October 2022, at 14.31.
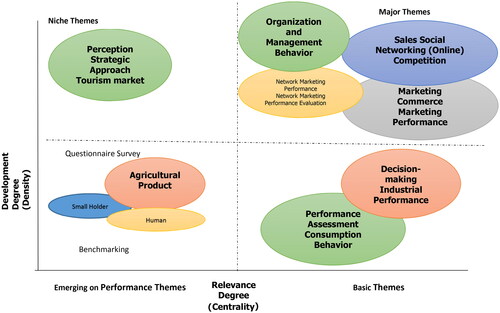
Figure 4. Most globally cited articles.
Source: Bibliometric Analysis with Scopus Data (1959–2022), R Program.
Retrieved: 19 October 2022, at 14.31.
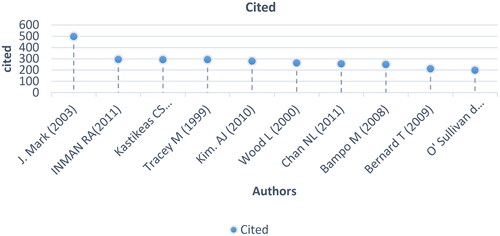
Figure 5. Marketing performance for SME model.
Adaptation construct from Morgan et al. (Citation2002), Lamberti and Noci (Citation2010), Katsikeas et al. (Citation2016), Bruce H. Clark (Citation1999), Ambler et al. (Citation2004).
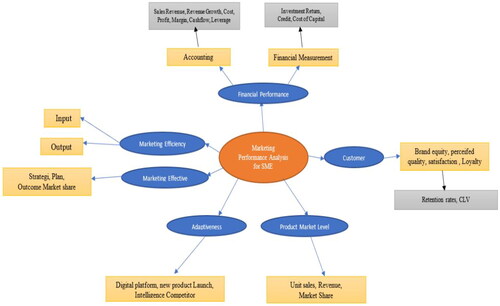
Table 5. KMO-MSA test.
KMO and Bartlett’s Test.
Table 6. Anti-image correlation.
Table 7. Communalities.
Table 8. Total variance explained.
Table 9. Variable indicators.
Table 10. Reliability test.
Figure 6. CFA diagram of the marketing performance.
Source: Questionnaire results processed by the Author (2022).
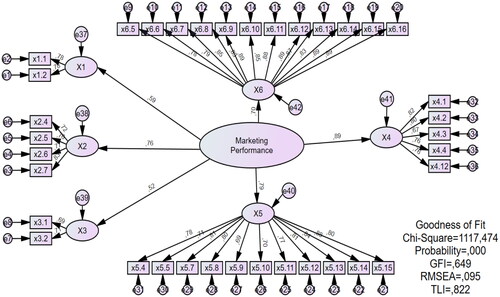
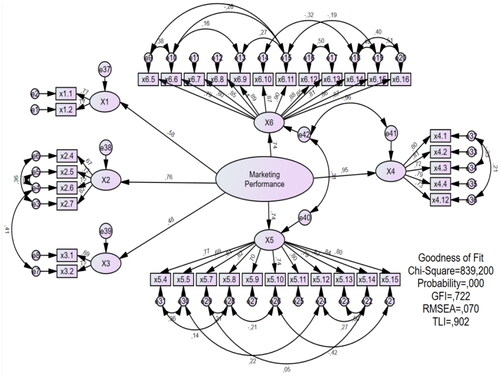
Figure 7. Modified CFA diagram of the marketing performance.
Source: Questionnaire results processed by the Author (2022).
Public Interest Statement Cogent.docx
Download MS Word (12.5 KB)Appendix_For_Cogent_BM_2024.docx
Download MS Word (1.1 MB)Data availability statement
Underlying Data:
This project contains the raw data of respondent responses
10.6084/m9.figshare.21786074
This project contains data Results that analyzed using Confirmatory Analysis
10.6084/m9.figshare.21805065
Extended data
Questionnaire for SMEs to confirm the model
10.6084/m9.figshare.21805035
Ethics clearance
10.6084/m9.figshare.21820083
