
Figures & data
Table 1. Review of recent empirical literature.
Figure 1. The distribution of the variables from 2010 to 2019. Note: inzscore is log of zscore; income is income diversification; asset is asset diversification; info 1 (information sharing) measured as natural log of Credit Reference Bureau enquiries made by banks; info 2 (information sharing) measured as cost of enquiries divided by total loans offered.
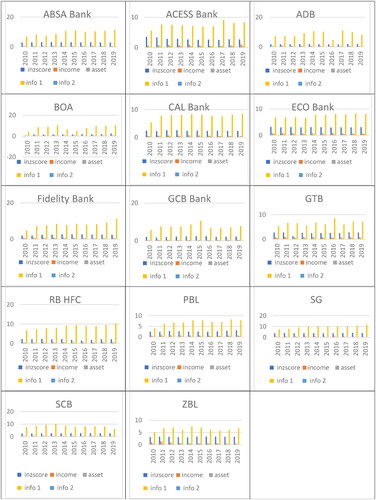
Table 2. Cross-sectional averaged distribution of the main variables.
Table 3. Definition of the variables.
Table 4. Descriptive statistics.
Table 5. The correlation matrix of the variables.
Table 6. The effect of income diversification, asset diversification and information sharing on systemic risk.
Table 7. Interaction effect of bank diversification and information sharing on systemic risk.
Table 8. The diagnostic tests.
