
Figures & data
Table 1. Sample selection process.
Table 2. Respondent and firm characteristics.
Figure 1. The Conceptual Frame work.
Source: Authors’ Conceptualisation.
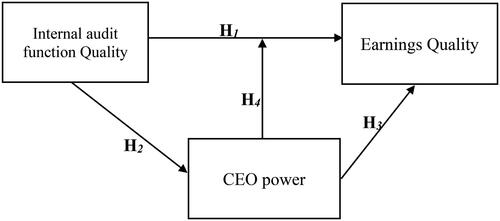
Table 3. Variable operationalisation and measurement.
Table 4. Summary of factors, validity and reliability tests for earnings quality and path coefficients -the measurement model for earnings quality.
Table 5. Summary of loading estimates, validity and reliability tests for internal audit function quality and path coefficients -the measurement model for internal audit function quality.
Table 6. Summary of Loading estimates, validity and reliability tests for CEO Power and path coefficients -the measurement model of CEO power.
Table 7. Descriptive statistics.
Table 8. ANOVA Global variables and firm sector.
Table 9. Global variables and position of respondents in a firm.
Table 10. Zero order matrix.
Table 11. Direct paths and hypothesized relationships.
Table 12. The moderation effect of CEO power in the relationship between internal audit function quality and earnings quality.
Table 13. Endogeneity Test.
Table A1. Rotated component matrix for CEO power.
Table A2. Rotated component matrix for internal audit function quality.
Table A3. Rotated component matrix for earnings quality.
Table A4. Moderation effect of CEO power in the relationship between internal audit function quality and earnings quality
Data availability statement
I confirm that the data set is available upon request.
