
Figures & data
Table 1. Supply chain resilience measures and meanings.
Table 2. Measurement items.
Table 3. PLS-SEM measurement model interpretation.
Figure 1. Conceptual model.
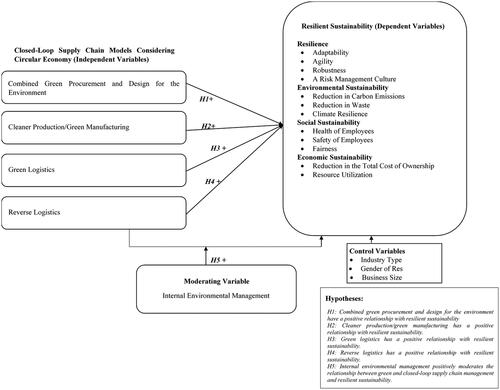
Figure 2. G power estimates.
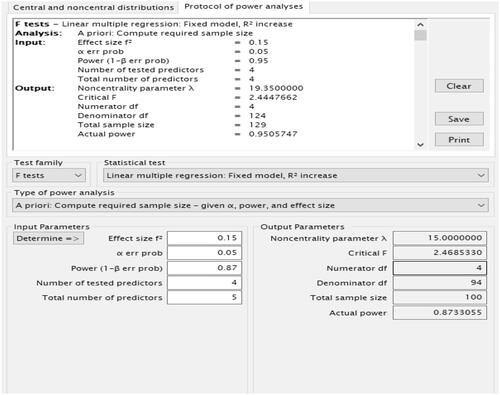
Figure 3. Confirmatory tetrad analysis interpretation (Wong, Citation2019).
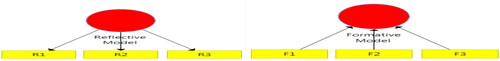
Figure 4. Research model- PLS-SEM graphical output (with moderator).
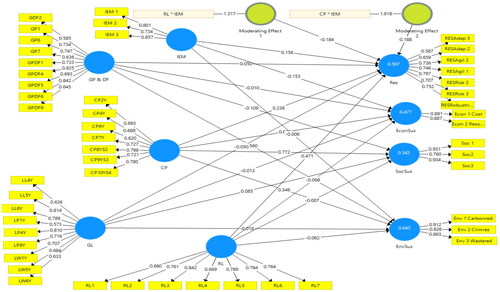
Table 4. PLS-SEM measurement model, indicator loadings.
Table 5. PLS-SEM measurement model-internal consistency reliability.
Table 6. PLS-SEM measurement model-convergent validity, AVE.
Table 7. PLS-SEM measurement model, discriminant validity.
Table 8. Demographic characteristics.
Table 9. PLS-SEM structural model, collinearity assessment using outer VIF.
Table 10. PLS-SEM structural model, R square and adjusted R square values.
Table 11. PLS-SEM structural model, F square values.
Table 12. PLS-SEM structural model, path coefficient values.
Table 13. PLS-SEM structural model, Q square (PLS-Predict, 10 folds, 10 repetitions): LV prediction summary.
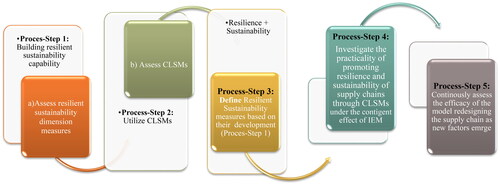
Figure 5. Integrated resilient sustainability framework based CLSMs (transitioning to the quadruple bottom line).
Data availability statement
The corresponding authors data supporting the findings of this study are available upon reasonable request.
