
Figures & data
Figure 1. Conceptual Framework of the Study Adapted from Amabile and Pratt (Citation2016).
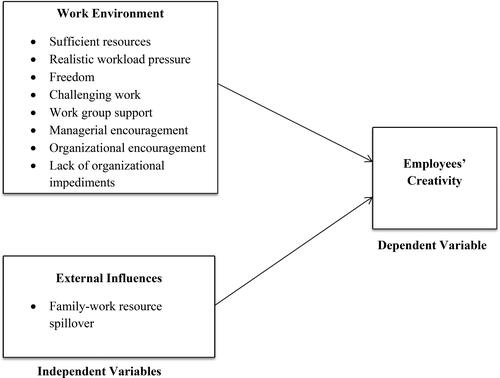
Table 1. Measurement model.
Table 2. Discriminant validity (Fornell-Larcker criterion).
Table 3. Collinearity statistics (Outer VIF values).
Table 4. Collinearity statistics (inner VIF values).
Table 5. R-square and model fit.
Figure 2. PLS-SEM showing relationships in variables (Ringle et al., Citation2022).
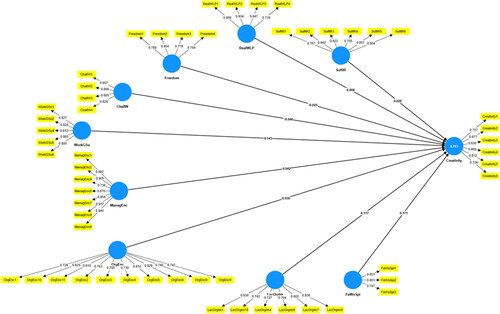
Table 6. Hypothesis constructs (Path coefficients, Mean, STDEV, T values, p values).
Availability of data and materials
Datasets for this study are available, and the same can be obtained from the corresponding author on reasonable request. This study was conducted in the context of Ethiopia; the data were collected from researchers working in the Ethiopian Institute of Agricultural Research (EIAR).
