
Figures & data
Figure 1. Research model. Source: Researchers proposed.
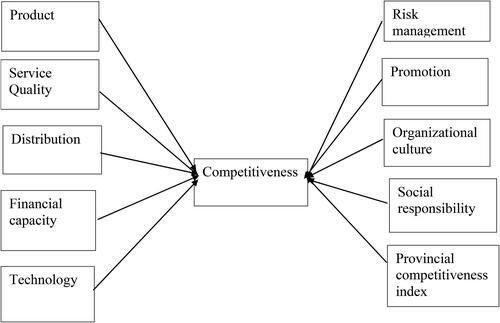
Figure 2. Competitive capacity in VietinBank by provinces. Source: The researchers’ collecting data.
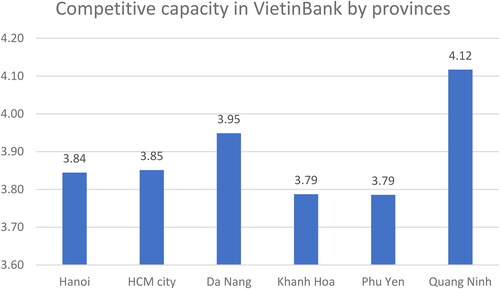
Table 1. Information about customers surveyed in VietinBank.
Table 2. Period of using retail service of customers by different ages.
Table 3. Period of using retail service of customers by different income.
Table 4. Reliability and validity of constructs.
Table 5. Discriminant validity.
Table 6. Coefficients from the structural equation modelling (SEM).
