
Figures & data
Table 1. Sample size determination.
Table 2. Frequency of destructive leadership behavior through multiple response method.
Table 3. Descriptive results of destructive leadership behavior.
Table 4. Measure of sampling adequacy result and pattern matrix.
Figure 1. Result of Eigen value.
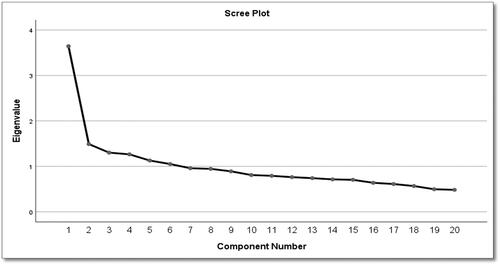
Table 5. Total variance in principal component analysis under Eigen value.
Table 6. Pattern matrix under Eigen value.
Table 7. Component correlation matrix under Eigen value.
Figure 2. The normality plot.
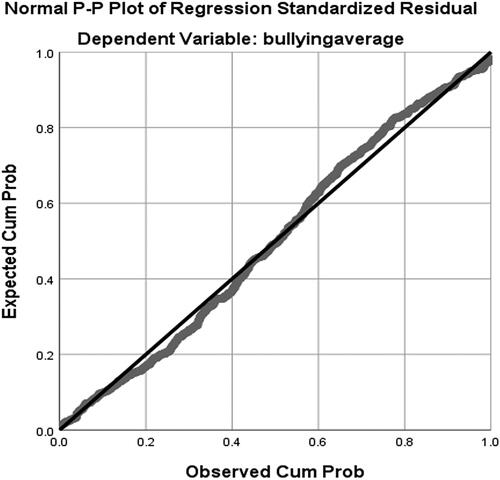
Figure 3. The homo-scedasticity plot.
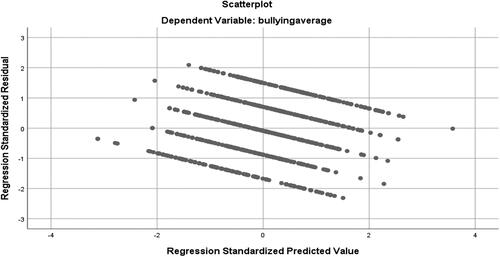
Table 8. Coefficients of the model.
Table 9. The ANOVA explained.
Table 10. Regression model of the study.
Figure 4. The regression standardized residual.
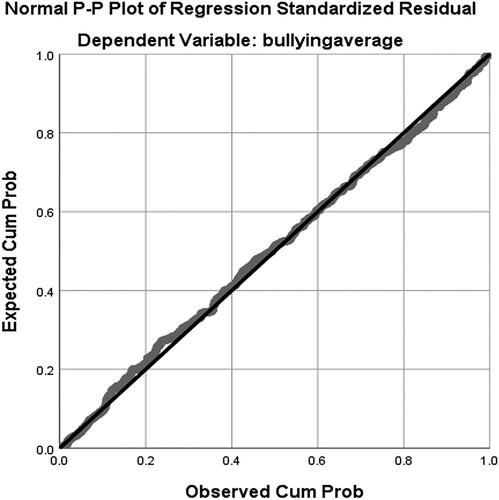
Table 11. Correlation coefficient.
