
Figures & data
Figure 1. Usual weekly working hours, by country and sex. Source: (Eurofound, Citation2016).
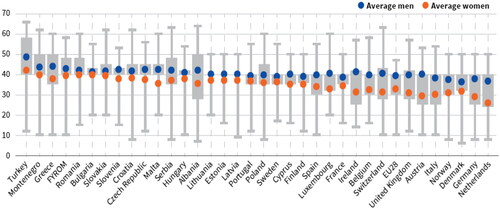
Table 1. Summary of response (Q87a–87e).
Table 4. Response for (Q90a–Q90c, Q90f).
Figure 2. Scree plots for PCA analysis of Q 87 a–e.
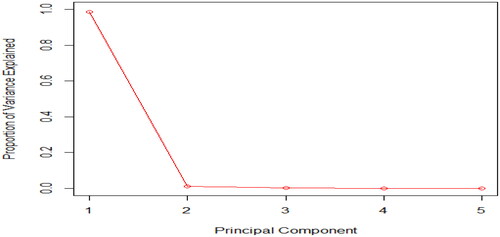
Table 2. Principal component analysis of European Working Conditions Survey conducted for Q87 a–e
Table 3. Principal component analysis for Q 87 a–e.
Figure 3. PCA for European working conditions survey for Q87a–e. Source: Author.
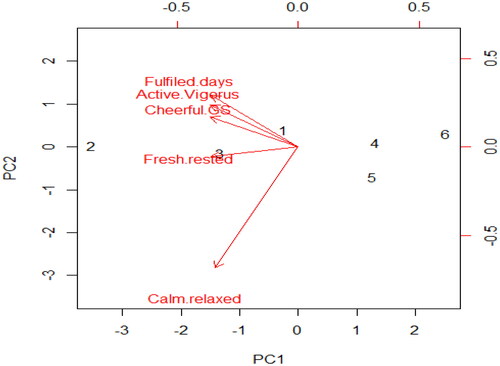
Figure 4. Scree plots for PCA analysis of Q90a–f.
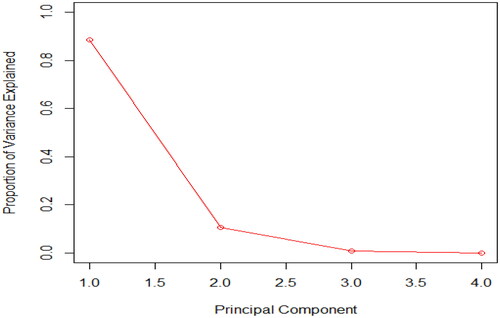
Figure 5. PCA for European working conditions survey for Q90a–f. Source: Author.
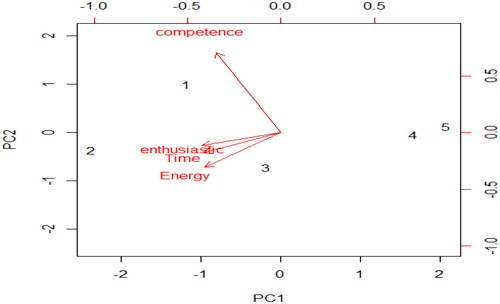
Figure 6. Plot showing relationship among the variables.
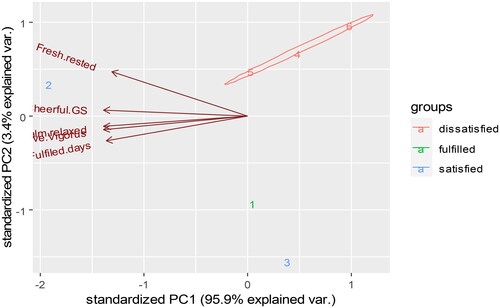
Table 5. Response (Q90a–Q90c, Q90f).
Table 6. Principal component analysis for Q90a–f.
Table 7. Principal component analysis for Q87 a–e.
Table 8. Principal component analysis for (Q90a–Q90c, Q90f).
Figure 7. Plot showing relationship among the variables for (Q90a–Q90c, Q90f).
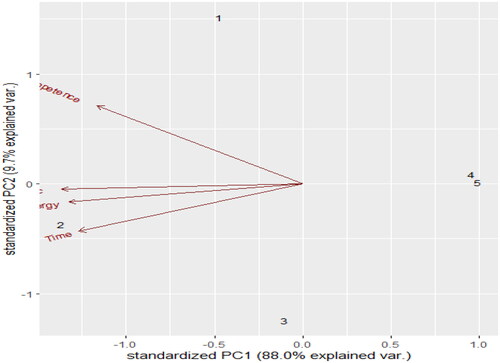
Table 9. PC1 and PC2 PCA for 2016 and 2022 Survey for Q87a–e.
Table 10. PC1 and PC2 PCA for 2016 and 2022 survey for Q90a–f.
