
Figures & data
Table 1. Variables measurement.
Table 2. Reliability of the instrument.
Figure 1. Structural equation model.
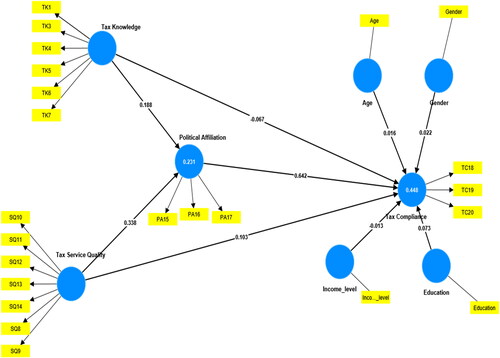
Table 3. Respondents’ demographics.
Table 4. Descriptive statistics.
Table 5. Correlation matrix.
Table 6. Results of validity and reliability of items constructs.
Table 7. Discriminant validity.
Table 8. Model goodness and significance.
Table 9. Hypothesis testing.
Table 10. Robust check based upon respondents’ demographic classification.
Table A1. Questionnaire.
Data availability statement
Data for this original research work will be available by the corresponding author upon request.
