
Figures & data
Table 1. Sampling frame.
Table 2. Measurement of study of variables.
Figure 1. Theoretical framework of analysis modified from Serkan et al. (Citation2011).
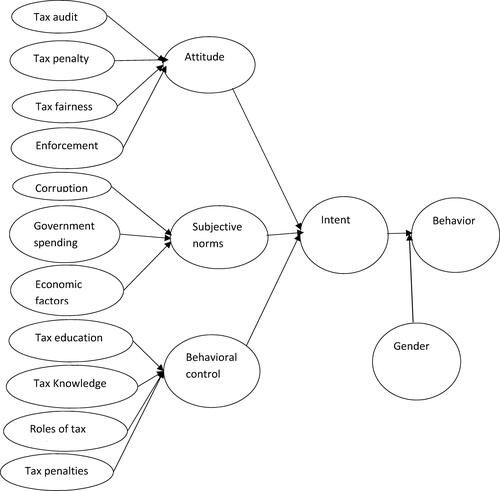
Figure 2. Group statistics on the determinants of taxpayers’ behaviour towards tax compliance between male and female taxpayers.
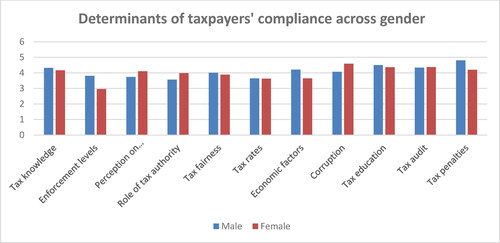
Table 3. Regression models.
Figure 3. Independent samples test for significance of the mean difference.
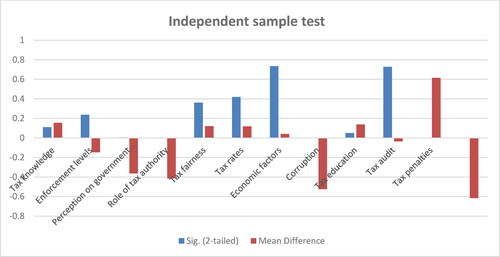
Figure 4. Multivariate testsa determinants of taxpayers’ compliance and gender.
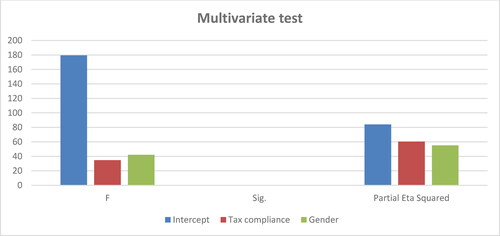
Figure 5. Levene’s test of equality of error variancesa.
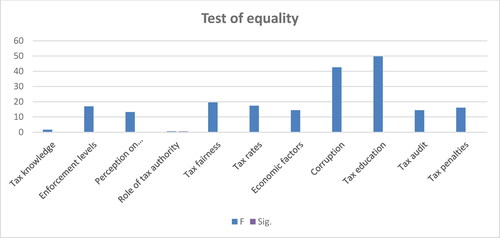
Figure 6. Test between subject effects.
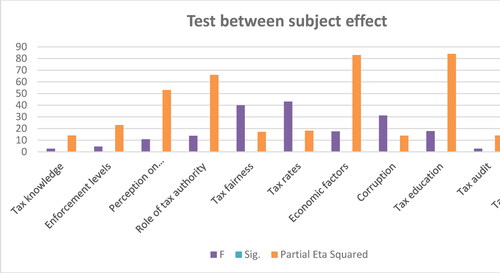
Table A1. Group statistics on the determinants of taxpayers’ beheviour towards tax compliance between male and female taxpayers.
Table A2. Independent test.
Table A3. Multivariate testsa determinants of taxpayers’ compliance and gender.
Table A4. Levene’s test of equality of error variancesa.
Table A5. Tests of between-subject effects.
Availability of data
Raw data were generated from different business enterprises in Rwanda. Derived data supporting the findings of this study are available from the corresponding author (Dr Daniel Twesige) on request
