
Figures & data
Figure 1. Research framework.
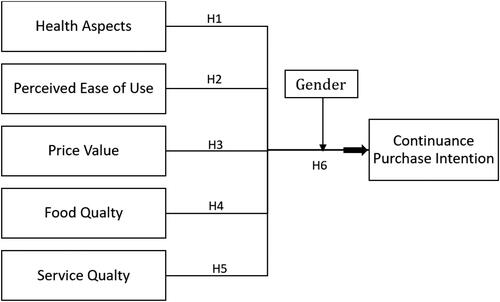
Table 1. Respondents’ demographic.
Table 2. General information.
Table 3. Different in central tendency and dispersion of variables among gender.
Table 4. Convergent validity.
Table 5. Discriminant validity by heterotrait-monotrait (HTMT) criterion.
Table 6. A summary of the assessment for the structural model.
Figure 2. The finalised PLS diagram.
Note: Outer-path coefficient, Inner-R square.
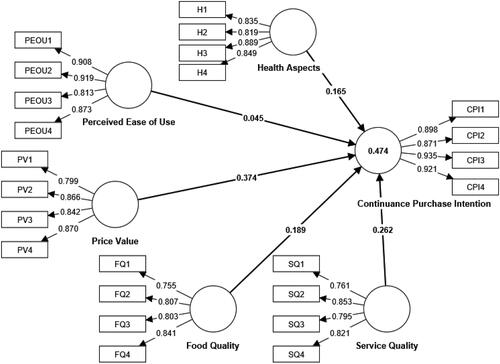
Table 7. Summary of MICOM assessment.
Table 8. Path coefficient of moderation–permutation.
Table 9. Summary of structured model based on genders.
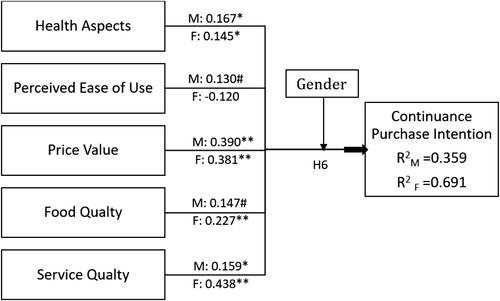
Figure 3. Overview of MGA results.
Notes: M = Male, F = Female, **p value < 0.01, *p-value <0.05, #p-value < 0.10.
Data availability statement
The data that support the findings of this study are available from the corresponding author upon reasonable request.
