
Figures & data
Figure 1. Theoretical/operational research model.
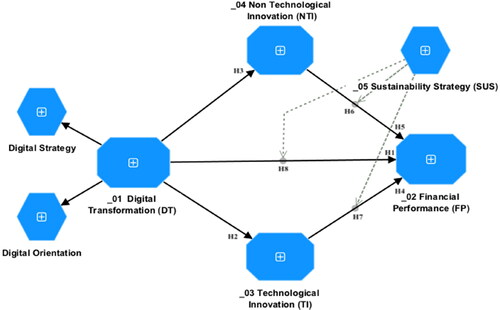
Table 1. Sample characteristics.
Table 2. Internal consistency of indicators.
Table 3. Reliability and validity of the constructs.
Table 4. Discriminant validity of the model: Fornell and Larcker criterion.
Table 5. Discriminant validity of the model (HTMT).
Table 6. Model hypothesis test.
Table 7. Internal consistency of indicators.
Figure 2. Moderating effect in the research model.
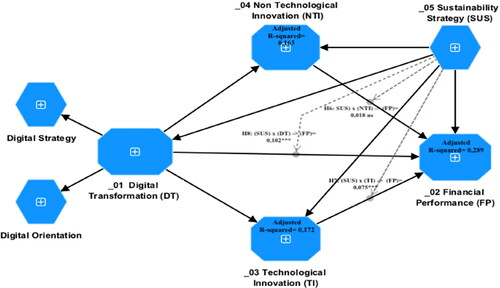
Table 8. Moderating effect hypothesis test.
Table 9. Configurational invariance and the compositional invariance.
Table 10. Differences in path coefficients (multigroup analysis).
Table 11. Adjusted R2 value differences (multigroup analysis).
Data availability statement
The data and the questionnaire used in the study are available to other authors who require access to this material.
