
Figures & data
Table 1. Summary of E-indexes used to measure ICT adoption.
Figure 1. Three stages in the evolution towards an information society.
Source: International Telecommunication Union (ITU).
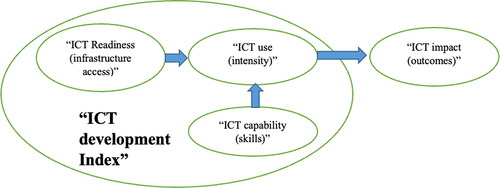
Table 2. Reference values obtained through statistical procedures.
Table 3. The indicators and weight in the ICT Development Index.
Table 4. Variable definition and data sources.
Table 5. Descriptive statistics for export demand function.
Table 6. Covariance matrix of export demand function.
Table 7. Unit root test-summary statistics for export demand function.
Table 8. Kao cointegration test for export demand function.
Table 9. Short run results (Wald test results) for export demand function.
Table 10. Descriptive statistics for import demand function.
Table 11. Covariance matrix of import demand function.
Table 12. Unit root test-summary statistics for import demand function.
Table 13. Kao cointegration test for import demand function.
Table 14. Short run results (Wald test results) for import demand function.
Table 15. Empirical results of export demand function.
Table 16. Empirical results of import demand function.
Table 17. White’s heteroscedasticity test.
Table 18. Multicollinearity test.
Table 19. Autocorrelation test.
Table 20. Specification test
Data availability statement
Supportive data will be provided upon request by the corresponding authors.
