Figures & data
Figure 1. PRISMA diagram describing the collection of research on Generation Z careers from the Scopus database.
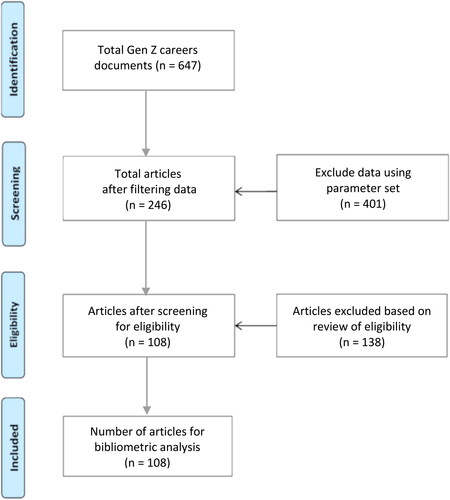
Table 1. Table of synonyms.
Table 2. Search queries.
Figure 2. The growth trajectory of research on Gen Z’s careers from 2016 to 2022.
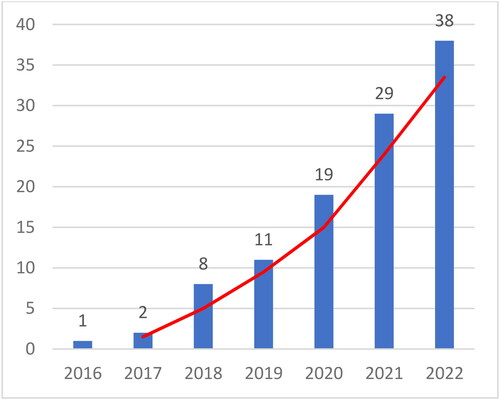
Table 3. The growth trajectory of research on Gen Z’s careers from 2016 to 2022.
Figure 3. Geographical distribution of Gen Z’s career publications across different countries in the period from 2016 to 2022.
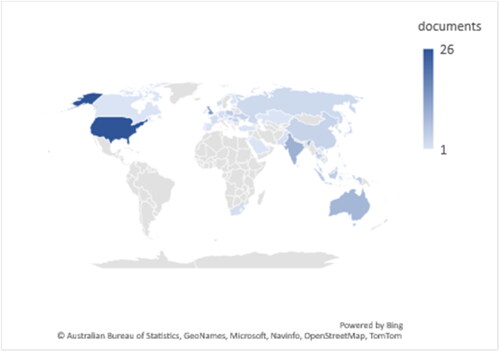
Table 4. Leading countries in GenZ’s Career as counted by the number of publications and citations (2016–2022).
Table 5. Leading authors in Gen Z’s careers the literature as accounted by the number of publications and total citations (2016–2022).
Figure 4. Co-authorship map of Gen Z’s careers literature (2016–2022) (display 396 authors, threshold 1 article).
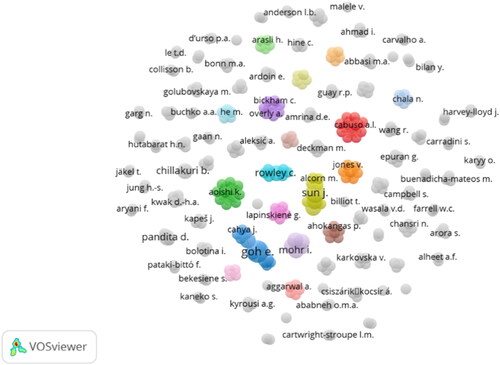
Figure 5. Co-authorship Map with Overlay Visualization (2016–2022) (display 396 authors, threshold 1 article).
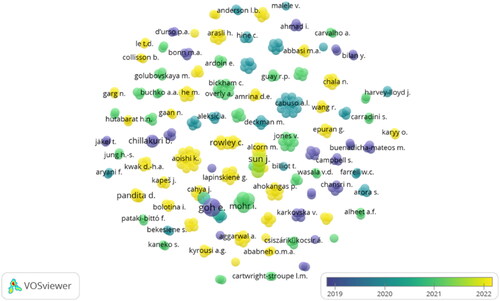
Table 6. Top ten leading sources in Gen Z’s careers research area rated by publication number (2016–2022).
Table 7. Top ten leading sources in Gen Z’s careers research area rated by citations number (2016–2022).
Table 8. Top ten most influential publications in Gen Z’s careers literature ranked by number of citations (2016–2022).
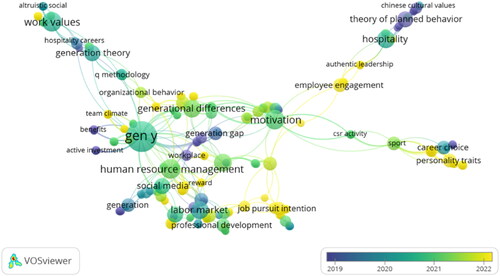
Figure 6. Network visualization map of co-occurrence keywords in GenZ’s careers research field (2016–2022) (total number of keywords: 273).
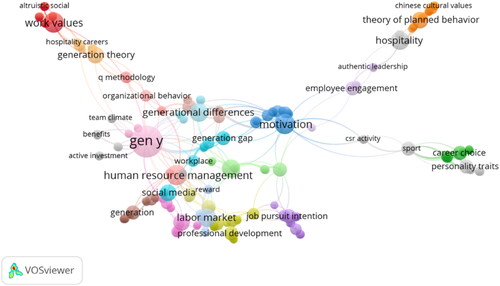
Figure 7. Keyword co-occurrence map with overlay visualization in Gen Z’s career research field (2016–2022).