
Figures & data
Table 1. Model summary.
Table 2. Descriptives.
Table 3. The regression results.
Figure 1. The share of new products in GDP.
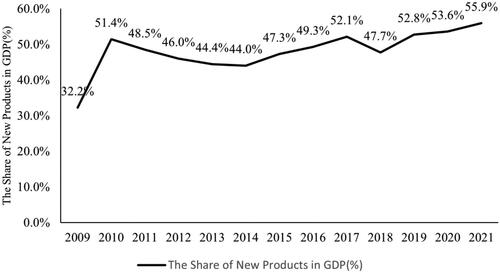
Figure 2. R&D employees’ density in Shenzhen, 2009–2021.
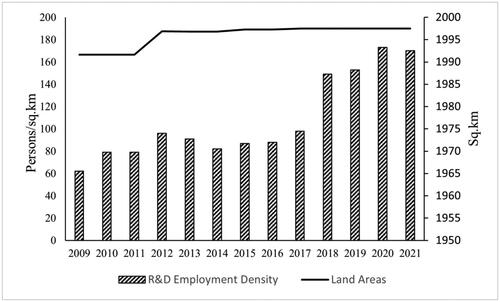
Table 4. Interactions among innovation actors of R&D activities in Shenzhen ICT industry.
Data availability statement
Data will be available on request. Authors agree to make data and materials supporting the results or analyses presented in their paper available upon reasonable request. The data that support the findings of this study are available in [SHENZHEN STATISTICAL YEARBOOK] at [http://tjj.sz.gov.cn/zwgk/zfxxgkml/tjsj/tjnj/]. The data of interviews that support the findings of this study are available from the author, [J.X], upon reasonable request.
