
Figures & data
Figure 1. Hypothesized theoretical Framework.
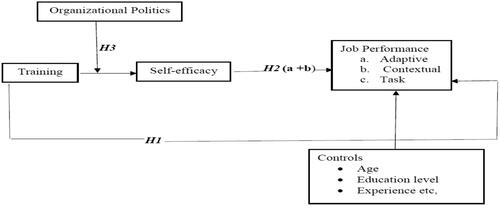
Table 1. Demographic profile of respondents.
Table 2. Reliability and validity tests.
Table 3. Validation of first order construct.
Table 4. Descriptive and correlation analysis.
Table 5. SEM regression analysis.
Figure 2. Path Diagram of the Effect of Training, Self-Efficacy and Organisational Politics on Overall Performance.
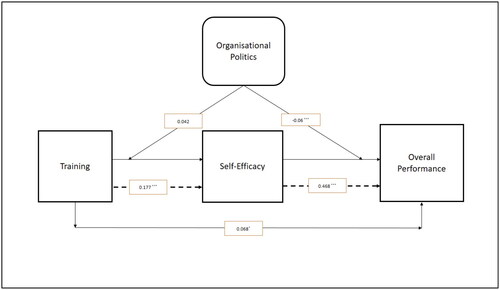
Figure 3. Path Diagram of the Effect of Training, Self-Efficacy and Organisational Politics on Task Performance.
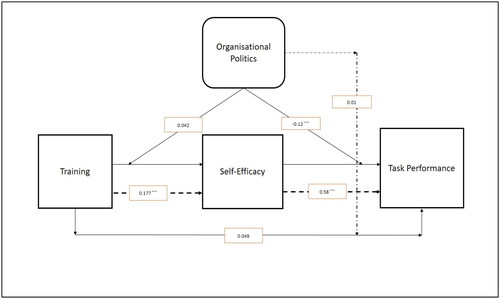
Figure 4. Path Diagram of the Effect of Training, Self-Efficacy and Organisational Politics on Contextual Performance.
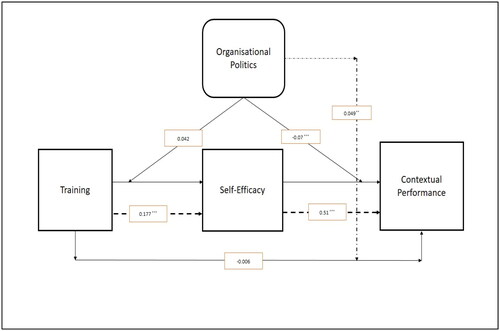
Figure 5. Path Diagram of the Effect of Training, Self-Efficacy and Organisational Politics on Adaptive Performance.
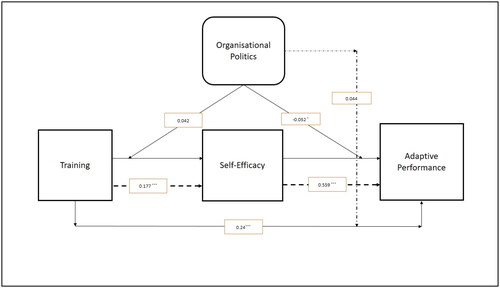
Figure 6. Plot of the Moderation of Organisational Politics on Self-Efficacy – Adaptive Performance Relationship.
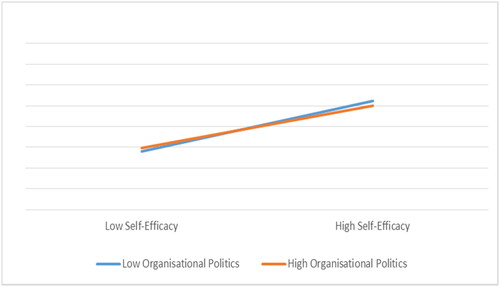
Figure 7. Plot of the Moderation of Organisational Politics on Self-Efficacy – Contextual Performance Relationship.
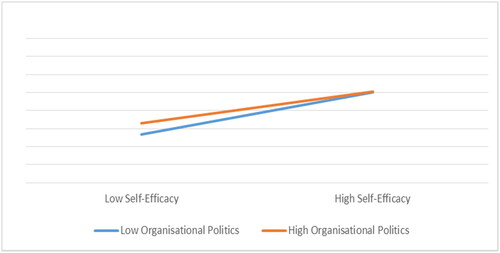
Figure 8. Plot of the Moderation of Organisational Politics on Self-Efficacy – Task Performance Relationship.
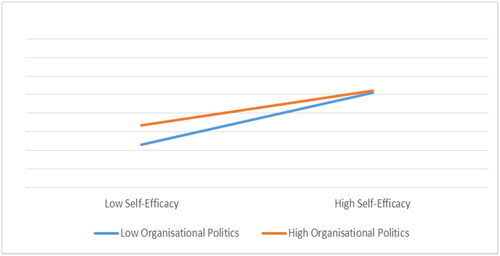
Figure 9. Plot of the Moderation of Organisational Politics on Training – Adaptive Performance Relationship.
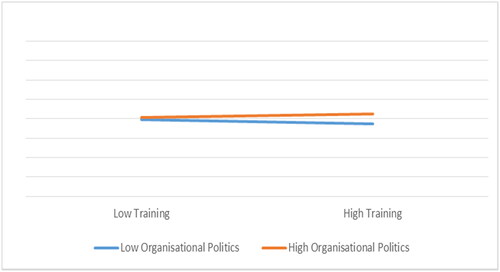
Table 6. Mediating effect of self-efficacy (indirect effect).
Data availability statement
Data availability statement will be made available on request.
