
Figures & data
Figure 1. Cross-sectional summary statistics for the dividend payout ratio for U.S. non-financial firms by year, from 1995 to 2018.
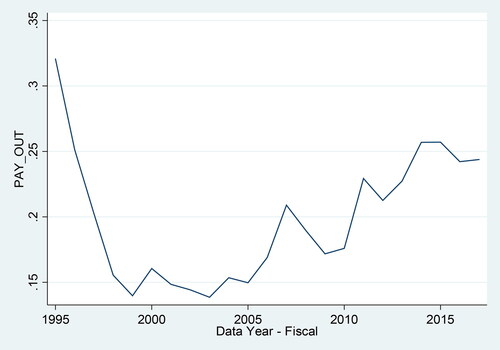
Figure 2. Cross-sectional summary statistics for the ratio of research and development to dividend payouts for U.S. non-financial firms by year, from 1995 to 2018.
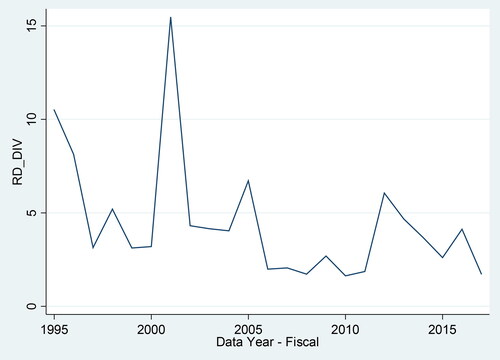
Table 1. Summary of sample characteristics.
Table 2. The impact of business strategy on dividend payments.
Table 3. Firm and year fixed effects.
Table 4. Subsample with prospector vs. defender firms.
Table 5. Endogeneity.
Table 6. Propensity score matching analysis.
Table 7. The effects of business strategy on corporate overinvestment and capital expenditure.
Table 8. Information environment, business strategy and dividend payments.
Table 9. Corporate Governance, business strategy and dividend payments.
Table 10. Policy uncertainty, business strategy and dividend payments.
Data availability statement
The data that support the findings of this study are available from the corresponding author upon reasonable request.
