
Figures & data
Table 1. Beef perception and consumption characteristics.
Figure 1. Model of the quality perception process (Steenkamp, Citation1990).
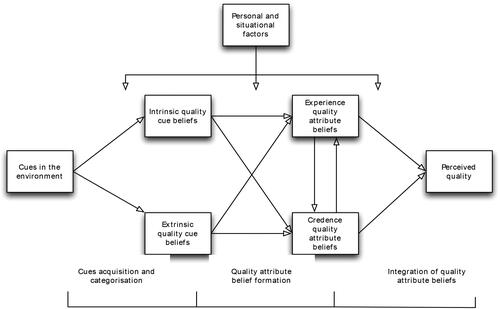
Figure 2. Conceptual model.
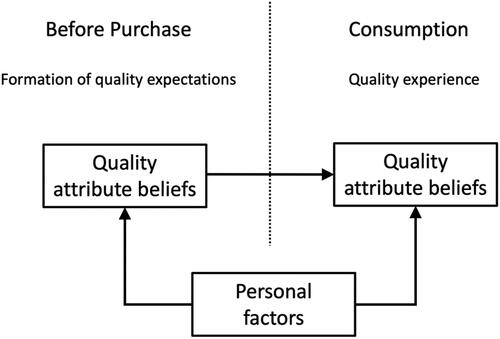
Figure 3. Research Model: The development of product quality beliefs.
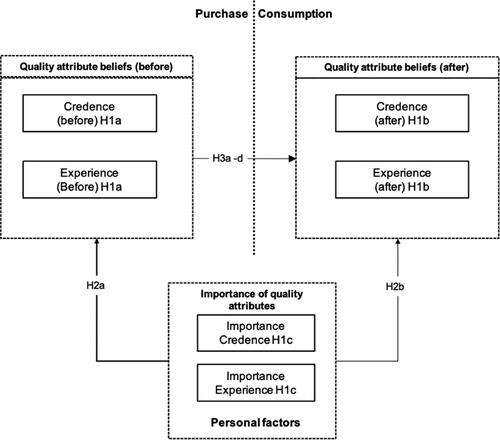
Table 2. Sample characteristics.
Figure 4. Comparison of the importance of attributes of beef for tourists when travelling overseas.
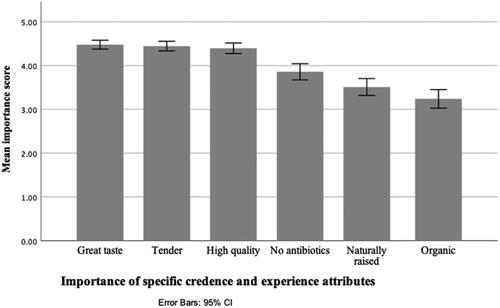
Figure 5. Change in the strength of credence and experience attribute beliefs before and after purchase and consumption.
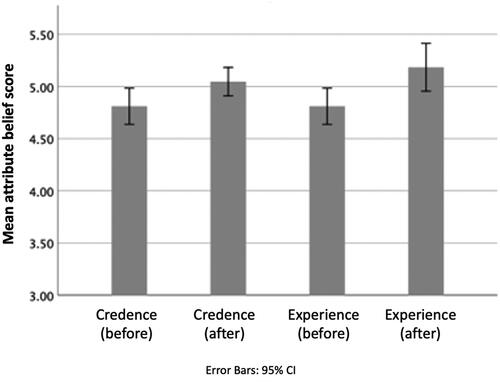
Table 3. Changes in tourists’ beliefs regarding the quality attributes of Vanuatu beef before and after visiting.
Table 4. Beliefs regarding quality attributes of Vanuatu beef before purchase and consumption.
Table 5. Percentage of variance explained – Beliefs regarding quality attributes before purchase and consumption.
Table 6. Beliefs regarding quality attributes of Vanuatu beef after purchase and consumption.
Table 7. Percentage of variance explained – Perception of quality attributes after purchase and consumption.
Table 8. Quality attributes of beef that are important to tourists.
Table 9. Percentage of variance explained – Importance of attributes.
Figure 6. Comparison of importance scores for credence and experience quality attributes.
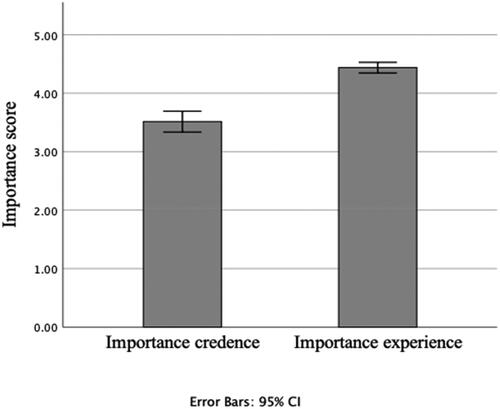
Table 10. Regression analysis for variables predicting credence quality beliefs - before purchase and consumption.
Table 11. Summary of results of hypotheses.
Table 12. Regression analysis for variables predicting experience quality beliefs before purchase and consumption.
Table 13. Regression analysis for variables predicting credence quality beliefs - after purchase and consumption.
Table 14. Regression analysis for variables predicting experience quality beliefs – after purchase and consumption.
Data availability statement
The data that support the findings of this study are available from the corresponding author, N. Lees upon reasonable request.
