
Figures & data
Figure 1. Conceptual framework. Source: Developed from the evidence of researchers review and (Yegzaw, Citation2022, Rahman Citation2019).
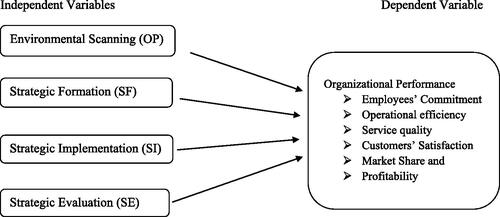
Table 1. Target population, sample size, and return rate and validity of the questionnaires.
Table 2. Reliability test for strategic perspectives and performance.
Table 3. Respondents’ perception of banks’ performance across strategic planning perspectives.
Table 4. Descriptive analysis for constructed variables and organizational performance.
Table 5. Correlation matrix.
Table 6. Co-linearity statistics.
Table 7. Breusch-Pagan/Cook-Weisberg test for heteroskedasticity.
Table 8. Goodness of fit/model fitness summary.
Table 9. Relation between coefficient of strategic planning perspectives & bank’s performance.
Likert scale Questioner_SPon OP.docx
Download MS Word (23.5 KB)Data availability statement
Available on request.
