
Figures & data
Figure 1. Trends in Female Force Participation in Uganda Compared to other developing East African Counties and the Sub-Saharan African (SSA) Region in general.
Source: Authors compilation from World Development Indicators (WDI), World Bank.
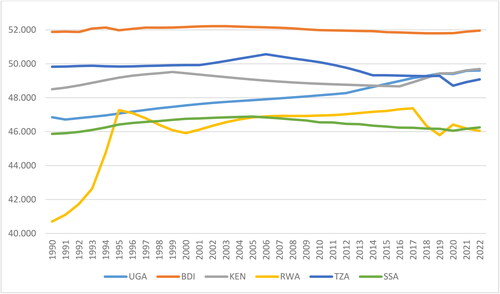
Figure 2. Female Labor Force Participation and Economic Growth, the U-shaped function.
Source: Gandhi (Citation2020), computed from WDI and ILOSTAT.
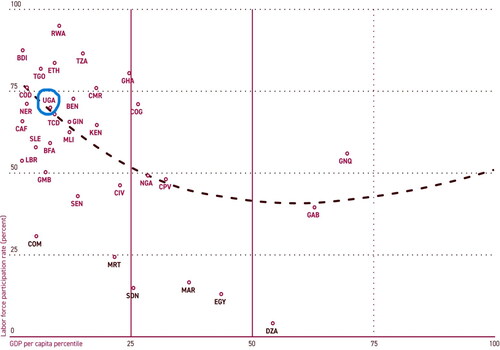
Figure 3. Predictive Margins of COVID-19 threat with a 95% Confidence Interval (CIs).
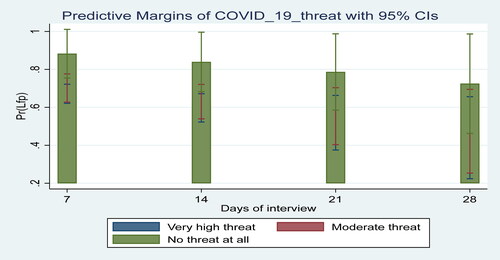
Table 1. Summary of the descriptive statistics.
Figure 4. Predictive Margins of COVID-19 threat with a 95% Confidence Interval (CIs).
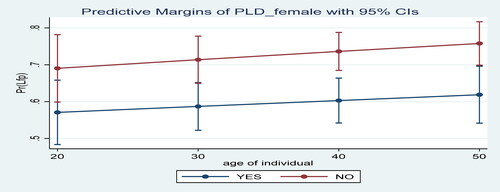
Table 2. The impact of COVID-19 lockdown on female labor force participation.
Table 3. The impact of COVID-19 Lockdown on Female Labor Force Participation: with subgroups.
Availability of data and materials
Data about the conclusions made in this study is available and it was downloaded from the World Bank website. Other additional datasets that support our results can be availed at the request of the corresponding author.
