
Figures & data
Figure 1. Research framework.
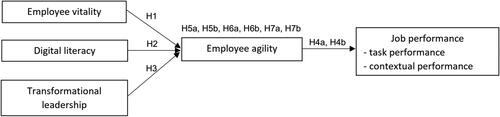
Table 1. Normality analysis.
Table 2. Comparison between baseline model and marker included model.
Table 3. Full collinearity test - VIF.
Table 4. Construct reliability analysis.
Table 5. Construct convergent validity (AVE).
Table 6. Reliability analysis, factor loading and AVE for higher-order constructs.
Figure 2. Structural model with interaction effect.
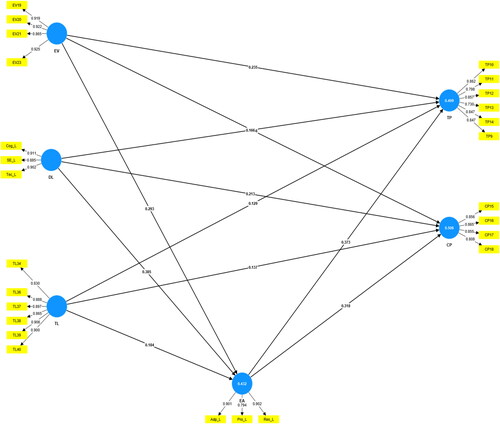
Table 7. Summary of total effects, direct effects and specific indirect effects of constructs.
Table 8. Coefficient of determination (r2).
Table 9. Assessment of effect sizes (f2).
Table 10. Predictive relevance of model (Q2).
Table A1. Respondent profile.
Table A2. Harman’s single-factor test.
Table A3. Factor loading.
Table A4. Fornell & larcker criterion.
Table A5. Cross loading.
Table A6. Heterotrait-Monotrait (HTMT) ratio.
Table A7. Fornell & larcker criterion for higher-order constructs.
Table A8. Heterotrait-Monotrait (HTMT) ratio for higher-order constructs.
Table A9. Multicollinearity statistics (VIF) for indicators.
Data availability statement
The data that support the findings of this study are openly available in Zenodo at https://doi.org/10.5281/zenodo.8082042
