
Figures & data
Figure 1. Hypothesized model (Source: based on LR).
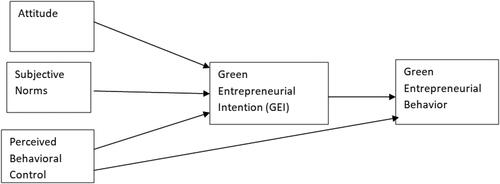
Table 1. Demographic profile of respondents (sample size 327).
Table 2. Factor loading.
Table 3. Results of convergent and Discriminant validity tests.
Table 4. Heterotrait monotrait ratio (HTMT).
Table 5. Model fit.
Figure 2. The structural model (Source: Research output).
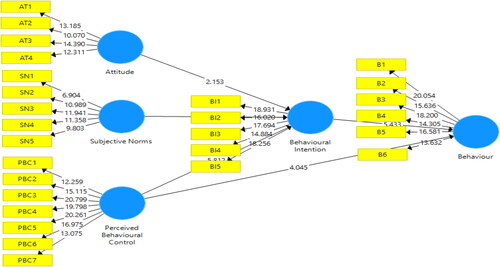
Table 6. Output bootstrapping-PLS.
Table 7. Q Square statistics.
Table 8. R-squares.
Table 9. Effect size (f2).
Table 10. Specific indirect effect.
Table 11. The summary of research hypotheses concerning mediating effects.
