
Figures & data
Figure 1. Systematic review methodology.
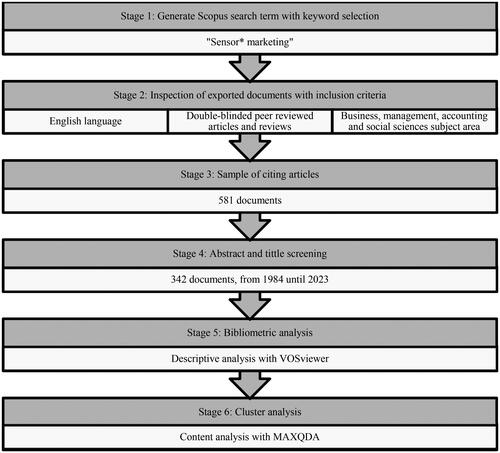
Figure 2. Number of publications per year in Sensory Marketing research since 1984.
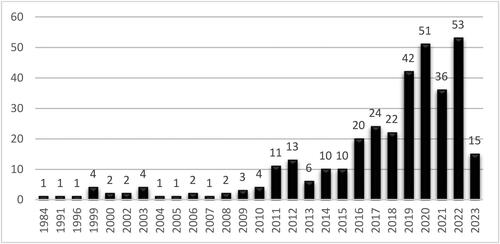
Table 1. Number of publications by category.
Table 2. Top 20 most productive journals.
Table 3. Top 10 most representative countries.
Figure 3. Bibliographic coupling network of countries.
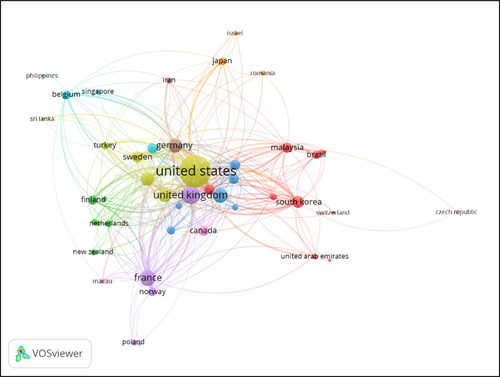
Table 4. Top 10 organizations.
Table 5. Top 10 documents by global citations.
Table 6. Top 10 keywords.
Figure 4. Network mapping of co-occurrences of author keywords.
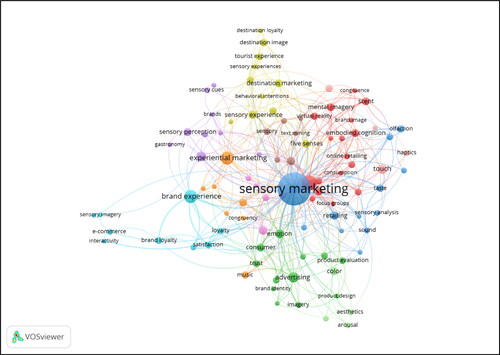
Figure 5. Overlay visualization of most frequent author keywords.
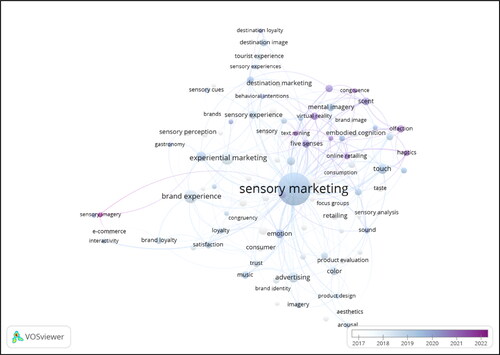
Table 7. Top 10 authors by publications.
Figure 6. Network mapping for co-authorship analysis.
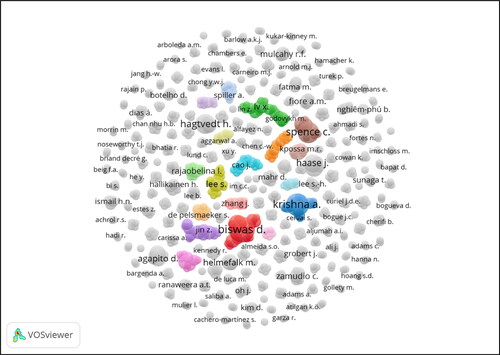
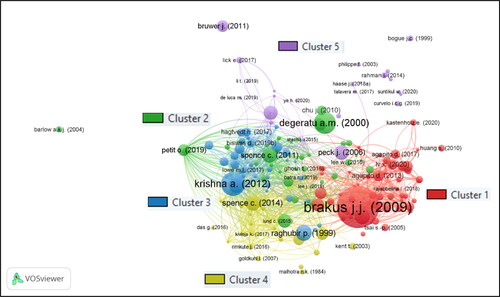
Figure 7. Bibliographic coupling.
Data availability statement
The data that support the findings of this study are openly available in Scopus at scopus.com.
