
Figures & data
Figure 1. Map Showing George Town’s Strategic Positioning between China and India. Note: The red circle highlights the geographic location of George Town, Penang, on the map. Source: Google Maps. (n.d.) (https://www.google.com/maps/@13.6960393,101.5092679,5z?entry = ttu).
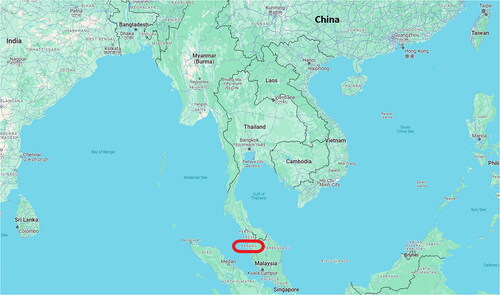
Figure 2. Map of core and buffer zones of the historic city of George Town. Note: The dark orange area represents the Core Zone, covering 109.38 hectares, while the light orange area represents the Buffer Zone, covering 150.04 hectares. Source: UNESCO, Citation2007 (https://whc.unesco.org/en/documents/101085/).
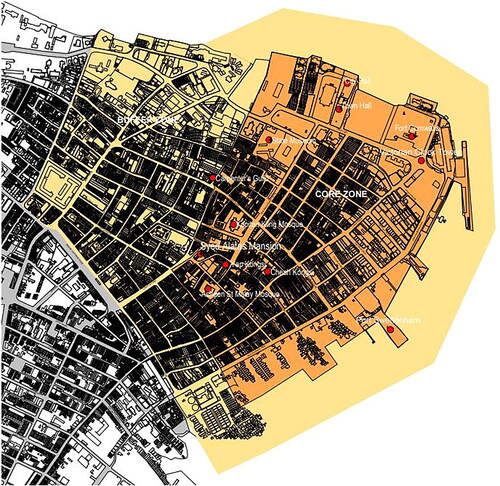
Table 1. Dimensions from SEO.
Table 2. Key elements from ToC.
Table 3. Comparative analysis of ORG01 and ORG02.
Data availability statement
The data supporting this study’s findings are available from the corresponding author, J.W.O., upon reasonable request.
