
Figures & data
Figure 1. The moderating role of NGQ in the CG-firm performance relationship.
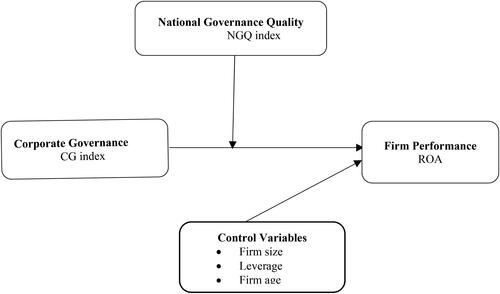
Table 1. Sample size determination.
Table 2. Variable description and measurements.
Table 3. Descriptive statistics.
Table 4. Correlation matrix.
Table 5. Results of unit root test.
Table 6. Diagnostic tests.
Table 7. Effect of CG on firm performance (ROA), with firm-level characteristics as the control variables.
Table 8. The moderating effect of NGQ on the relationship between CG and firm performance (ROA), with firm-level characteristics as the control variables.
Table 9. The moderating effect of NGQ on the relationship between CG and firm performance (Tobin Q), with firm-level characteristics as the control variables.
Data availability statement
Data for the study is obtained from publicly available sources and can also be made available upon request.
