
Figures & data
Table 1. Sequence of GPC-1 shRNA and GPC-1 overexpression plasmid.
Table 2. Primer sequences.
Table 3. List of antibodies.
Figure 1. Expression of GPC-1 and PI3K/Akt is upregulated in esophageal adenocarcinoma.(a-c) GPC-1, Akt, and PI3K expression in tumor (n = 230) and paratumor tissue (n = 135) samples in TCGA project through the utilization of Student’s t-test. The tumor tissues are marked with red color and paratumor tissues are denoted by gray color. (d-e) Pearson’s correlation of GPC-1 expression with Akt and PI3K in TCGA project.
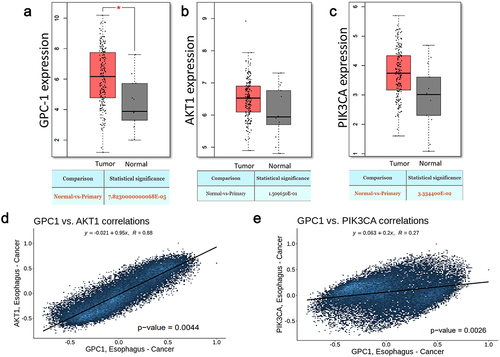
Figure 2. Expression of GPC-1 is upregulated in poorly differentiated esophageal adenocarcinoma. (a) Esophageal adenocarcinoma (EAC) tissues were observed to manifest an upregulation of GPC-1 expression compared to normal para tumor tissue in 25 paired tissues with poorly differentiated chemoresistant EAC at the University of Colorado. (b) Representative IHC photographs of normal paratumor gastroesophageal junction stained for GPC-1 (a-c) and tumor tissue stained for GPC-1(d-f) showing GPC-1 staining of normal paratumor gastroesophageal junction (black arrows). GPC-1 immunoreactivity is seen in basal and suprabasal layers of normal stratified epithelium. The normal paratumor stroma (red star), crypt epithelium, or columnar epithelium does not stain with GPC-1. Moderate to intense staining is noted in the stroma and columnar epithelium (red star). (c-d) Real-time q-PCR and western blot analysis of GPC-1 mRNA and protein in 10 paired tumor and paratumor tissue. The bar chart represents mean ±SD, n = 3. **, P < 0.01.
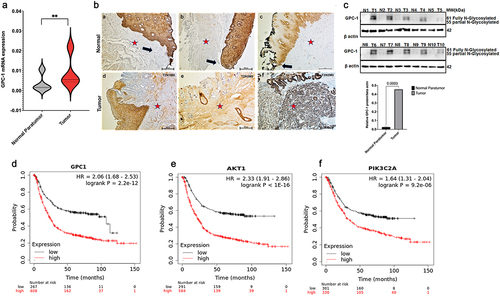
Table 4. Univariate and multivariate analysis of prognostic variables in chemo-resistant PDEAC.
Figure 3. Expression and localization of GPC-1 in PDEAC cell lines. (a) Western blot analysis of GPC-1 expression in seven PDEAC cell lines compared to normal esophageal cell line HET-1A and Barrett’s cell lines (CP-A and CP-B). Bar chart of densitometry analysis of GPC-1 protein expression in PDEAC cell lines. (b) Representative immunofluorescence staining of normal HET-1A cells and PDEAC cells (ESO-26, OE-33). Cells were stained with DAPI (blue), GPC-1(FITC), and Tubulin (Texas red). The scale bar represents 50 µm. (c) Representative images of insitu Proximity ligation assays (PLA) of two EAC cell lines with anti GPC-1 and anti β-tubulin antibodies. Scale bar 100 µm. DAPI, 4’,6-diamidino-2-phenylindole; FITC, fluorescein isothiocyanate; ns; not significant, **** p < .0001.
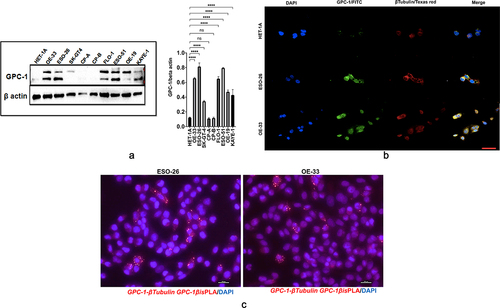
Figure 4a. Glypican 1 mediates growth and proliferation in esophageal cancer (a) the results of the Gene Set Enrichment Analysis (GSEA) identify pathways that exhibit a significantly impactful relationship of GPC-1 in EAC. (b) Stably expressing SCR and shGPC-1β expressing cell lines ESO-26 and OE-33 cells were evaluated for cell viability by CCK-8 assay at various time points. (c-d) Light microscopy images (magnification 20×) of scratch assay taken at 0 and 72 h after transfection. (e)light microscopy images (magnification 20×) of Transwell assay in either uncoated (for migration) or Matrigel-coated (for invasion) polycarbonate 8 µm chambers. Migrated cells at the bottom of inserts were stained with 0.1% crystal violet. (f) ESO-26 and OE-33 cells were transfected with scramble shRNA and shGPC-1β and grown for 14 days, stained with crystal violet, and the number of colonies was counted. (g) Western blot analysis (left) and densitometric analysis(right) of key proteins in EMT and stemness. Bar charts represent mean ±SD, n = 3. ns; not significant, *p < .05,**p < .01, ***p = .002, ****p < .001.
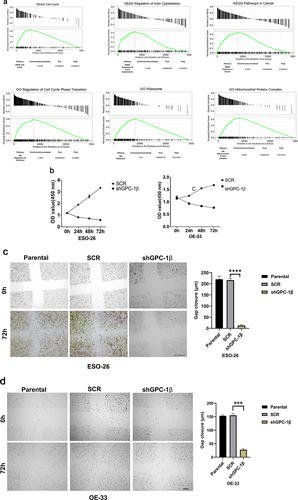
Figure 4b. Continue
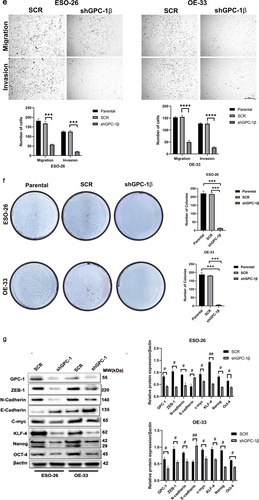
Figure 5. PDEAC cells have constitutively activated PI3K/Akt signaling driven by GPC-1 (a) Western blot analysis of key proteins of PI3K/Akt pathway was probed in normal HET-1A and PDEAC cell lines (ESO-26 and OE-33 cells). (b) Western blot analysis of PI3K/Akt pathway proteins after overexpression of GPC-1 in SK-GT4 cells. Bar chart of densitometry analysis of the ratio of phosphorylated to non-phosphorylated protein normalized to β-actin. Data represent mean ±SD, n = 3. EV, empty vector.
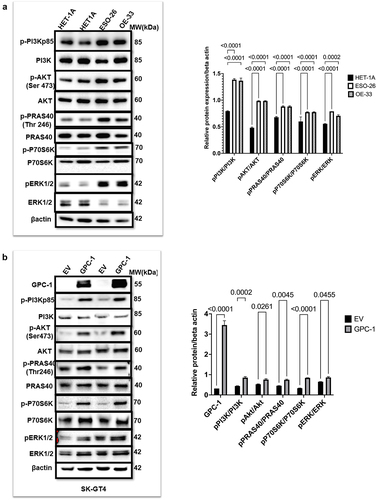
Figure 6. Upregulated GPC-1 expression promotes resistance to Pictilisib treatment. Cell viability was assessed using CCK-8 assay with treatment with Pictilisib (0.1 to 10 μM) for 48 h in (a) ESO-26 (b)OE-33 and (c) SK-GT4 cells. (d-e) Western blot analysis showing expression of p-Akt (Ser473) with varying concentrations of Pictilisib. Beta-actin was used as a loading control. (f- g) GPC-1High stably expressing SCR and shGPC-1β expressing cell lines were treated with a range of concentrations (0.1 to 10 μM) of Pictilisib. CCK-8 assay was used to measure cell viability and IC50 48 h after treatment. The IC50value of ESO-26shSCR and ESO-26shGPC-1β 3.54 µM and 0.32 µM respectively. The IC50value of OE-336shSCR and OE-33shGPC-1β 1.34 µM and 0.309 µM respectively. (h) Clonogenic survival assays in GPC-1High stably expressing SCR and shGPC-1β expressing cell lines (ESO-26 and OE-33) treated with the indicated doses (µM) of Pictilisib for 48 hours. Media was changed and cells were then cultured for 14 days without inhibitor, fixed with 4% paraformaldehyde and stained with 0.1%crystal violet. Colonies were counted and expressed as a percentage of the SCR control. **p < .01; ***p < .001.
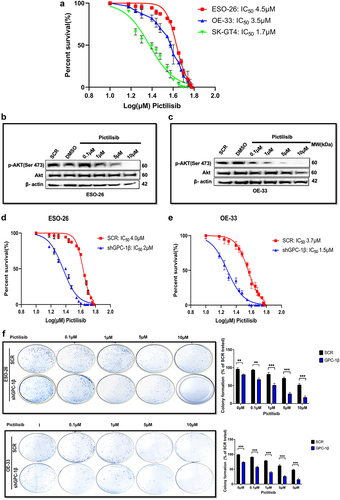
Figure 7. GPC-1knockdown sensitized GPC-1high expressing PDEAC cells to antitumor effects of low dose Pictilisib via downregulating Akt signaling. (a) GPC-1High stably expressing SCR and shGPC-1β expressing cell lines were treated with low dose Pictilisib (IC25) for 48 h and CCK-8 assay was used to measure cell viability. (b) Clonogenic survival assays in GPC-1High stably expressing SCR and shGPC-1β expressing cell lines (ESO-26 and OE-33) treated with Pictilisib (IC25, µM) for 48 hours. Media was changed, cells were cultured for 14 days without inhibitor, fixed with 4% paraformaldehyde and stained with 0.1%crystal violet. Colonies were counted and expressed as a percentage of the SCR control. (c-d) Western blot showing expression of p-AKT(Ser473) levels at shown time points after treatment of GPC-1High shGPC-1β expressing cell lines (ESO-26 and OE-33 cells) with low dose Pictilisib (IC25). Combinatorial treatment with low dose Pictilisib synergistically reduced p-AKT level in both cell lines at 48 h. ns, not significant; ***p < .001.
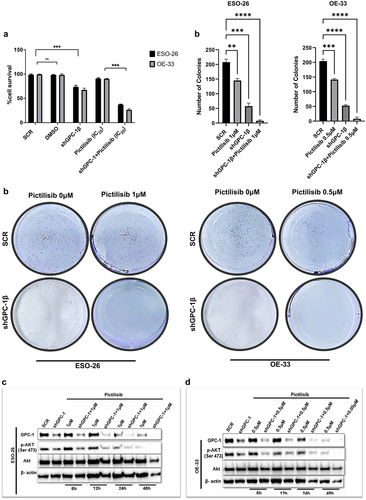
Figure 8. Silencing GPC-1 alone or in combination with Pictilisib effectively downregulates PI3K/Akt/ERK pathway. (a-b) GPC-1High stably expressing SCR and shGPC-1β expressing cell lines were treated with low dose Pictilisib (IC25) for 48 h and cell lysates were subjected to western blot analysis with antibodies for GPC-1, p-AKT(Ser473), total Akt, p-PRAS(Thr246), total PRAS, p-P70S6K, total P70S6K, p-ERK1/2 and total ERK1/2. Beta-actin was used as a loading control.
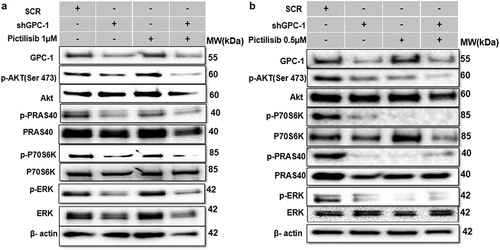
Figure 9a. Knockdown of GPC-1 enhanced Pictilisib induced apoptosis and cell cycle arrest in G0/G1 phase in PDEAC cells. (a) GPC-1High stably expressing SCR and shGPC-1β expressing cell lines were treated with low dose Pictilisib (IC25) for 48 h and evaluated for apoptosis using Annexin V/FITC using flow cytometry. the downregulation of GPC-1 synergized with low-dose Pictilisib to induce apoptosis in ESO-26 and OE-33 cells. (b\) GPC-1High stably expressing SCR and shGPC-1β expressing cell lines were treated with low dose Pictilisib (IC25) for 48 h and evaluated for the cell cycle stage using Propidium iodide staining followed by flow cytometry Data represents n = 3, mean ± SD; ordinary one ANOVA with multiple comparisons, *, P < 0.05, SCR, negative scrambled control; shGPC-1β, GPC-1 knockdown plasmid; FITC, fluorescein isothiocyanate.
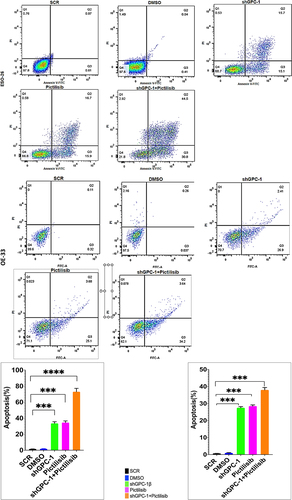
Figure 9b. Continue
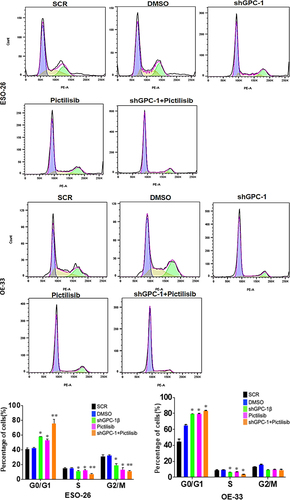
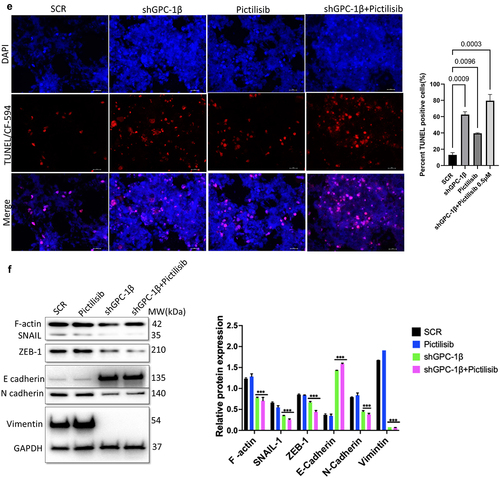
Figure 10a. Combination of GPC-1 knockdown and Pictilisib results in greater tumor growth inhibition in-vivo. (a) Knockdown of GPC-1 notably inhibited the growth of ESO-26 which was more significant after combination with Pictilisib. (b-c) Tumor volumes and weight of xenografts were significantly reduced with combination treatment. (d) Immunohistochemistry staining for Ki67. Scale bar: 10 µm. (e) Fluorescent images of xenograft tissue sections stained for TUNEL staining using a TUNEL/CF-594 staining kit. Blue denotes DAPI, red denotes CF-594 and pink denotes merged condensed chromatin within the nucleus. Scale bar: 50 µm. (f) Western blot analysis of EMT proteins at the treatment endpoint of 15 days. Data represents the mean ± SD of 4 animals. **p < .01; ***p < .001.
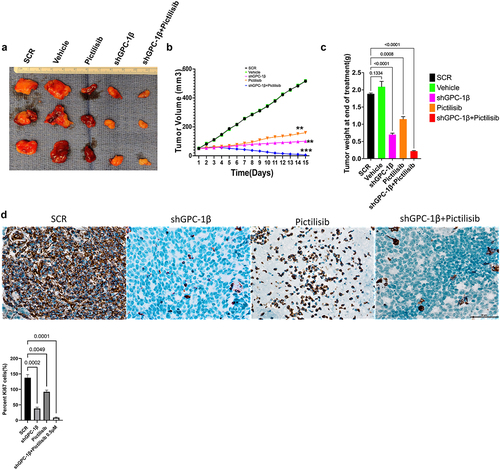
Figure 10b. Continue
Supplemental Material
Download JPEG Image (2.4 MB)
Supplemental Material
Download JPEG Image (3.1 MB)
Supplemental Material
Download JPEG Image (2.5 MB)
Supplemental Material
Download JPEG Image (7 MB)
Supplemental Material
Download MS Word (12.7 KB)Data availability statement
The data that support the findings of this study are available from the corresponding author, [AP], upon reasonable request to [email protected].