
Figures & data
Figure 1. Viability of lung cancer, A549 and NCI-H292, and normal lung, MRC-5, cells treated with the ethanolic Mangifera indica L. kernel extract after 24 h, determined by the MTT assay. A549 = human adenocarcinoma alveolar basal epithelial cell; NCI-H292 = human muco-epidermoid bronchiolar carcinoma cell; MRC-5 = normal human lung cell. Values are mean ± standard deviation (n = 3 wells/treatment). p < .05 determined the significant differences among means.
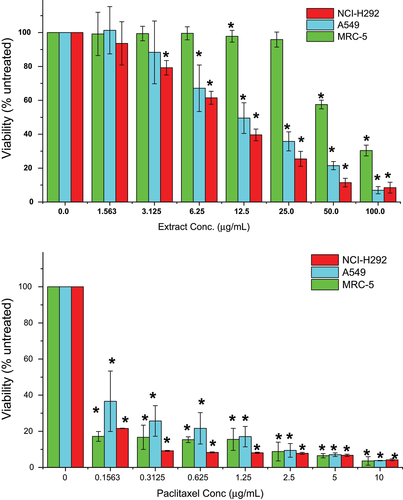
Table 1. IC50* values of mangifera indica L. kernel ethanolic extract and paclitaxel on NCI-H292, A549 and MRC-5 cells after 24 hours treatment.
Figure 2. Proliferation of lung cancer, A549 and NCI-H292, and normal lung, MRC-5, cells treated with the ethanolic Mangifera indica L. kernel extract for 24, 48, or 72 h, determined by the BrdUassay.A549 = human adenocarcinoma alveolar basal epithelial cell; NCI-H292 = human muco-epidermoid bronchiolar carcinoma cell; MRC-5 = normal human lung cell. Values are mean ± standard deviation (n = 3 wells/treatment). p < .05 determined the significant differences among means.
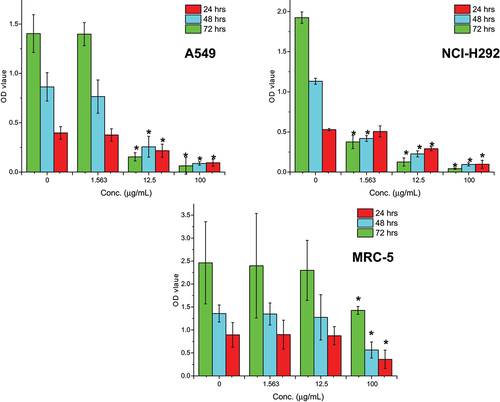
Figure 3. Morphology of lung cancer, A549 and NCI-H292, and normal lung, MRC-5, cells treated with the ethanolic Mangifera indica L. kernel extract at the IC50 concentration of 12.33, 9.55, and 63.86 μg/mL, respectively, for 24 h. A549 = human adenocarcinoma alveolar basal epithelial cell; NCI-H292 = human muco-epidermoid bronchiolar carcinoma cell; MRC-5 = normal human lung cell. Magnification: 200×.
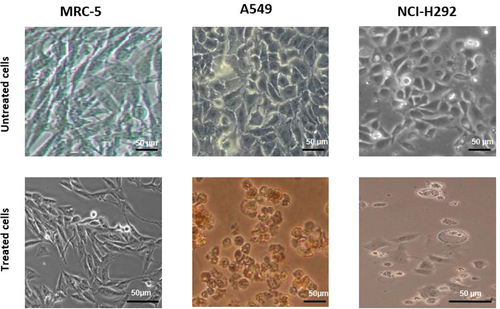
Figure 4. Effects of ethanolic Mangifera indica L. kernel extract at IC50 concentrations on cell cycle distribution of NCI-H292, A549 and MRC-5 cells and analyzed by flow cytometry. G0/G1, G2/M and S DNA contents indicate the cell phase, while and sub-G1 refers to the proportion of apoptotic cells. Values are means ± standard deviations (n = 3 well/treatment). *P<.05 compared to non-treated cells.
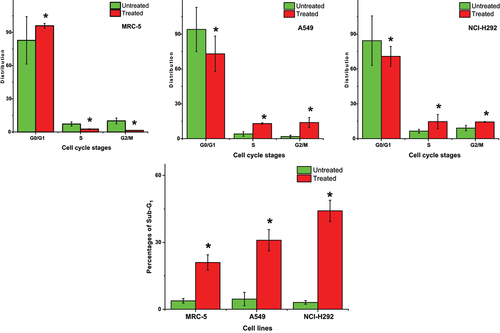
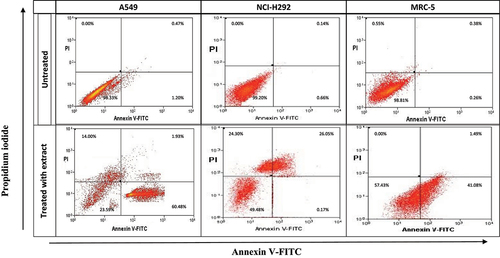
Figure 5. Scatter graph depicting annexin V (an) and propidium iodide (PI) double-staining assay of NCI-H292, A549 and MRC-5 cells treated with Mangifera indica L. kernel ethanolic extract at IC50 concentrations for 24 h. The Y-axis represents the PI-labeled population, whereas the X-axis represents the FITC-labeled annexin V positive cells. The lower left portion of the fluorocytogram (an ̶, PI ̶) shows viable cells, whereas the lower right portion of the fluorocytogram (An+, PI ̶) shows early apoptotic cells. The upper right portion of the fluorocytogram (An+, PI+) shows late apoptotic cells, whereas the upper left portion of the fluorocytogram (an ̶, PI+) shows necrotic cells.
supplementary.docx
Download MS Word (153.9 KB)Data availability statement
The data that support the findings of this study are available from the corresponding author upon reasonable request. Restrictions apply to the availability of these data, which were used under license for the current study and so are not publicly available. However, data are available from the authors upon reasonable request and with permission of the data owner.