Figures & data
Figure 1. (a) Response of HNSCC cell lines, A253, CAL27, Det562 and FaDu to cisplatin: HNSCC cells were treated with varying concentration of cisplatin for 72 h and IC50 was determined by MTT assay. The IC50 of A253, FaDu, Det562 and CAL27 was found to be 1.5 µM, 2 µM, 1.5 µM and 2 µM, respectively (b) Workflow employed to identify proteins altered in response to cisplatin. HNSCC cells were treated with cisplatin at their IC50 for 24 h. Untreated cells served as control. Equal amount of protein from both the conditions was subjected to trypsin digestion followed by mass spectrometry analysis.
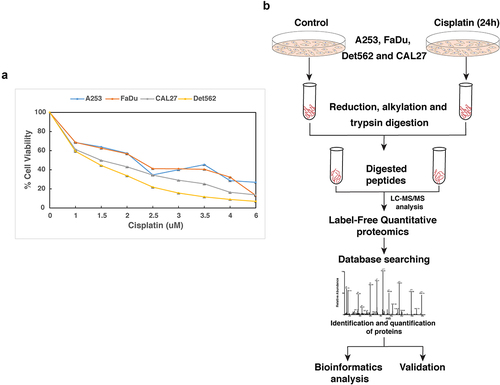
Table 1. Partial list of proteins that are differentially regulated in cisplatin treated HNSCC cell lines compared to untreated cells.
Figure 2. Protein-protein interaction (PPI) network of proteins implicated in DNA damage response and repair. Proteins associated with DNA damage and repair were shortlisted from list of proteins altered upon cisplatin treatment. An PPI network was created based on literature evidence using the tool, Pathvisio. The number on each protein indicates the fold change observed upon cisplatin treatment compared to untreated cells.
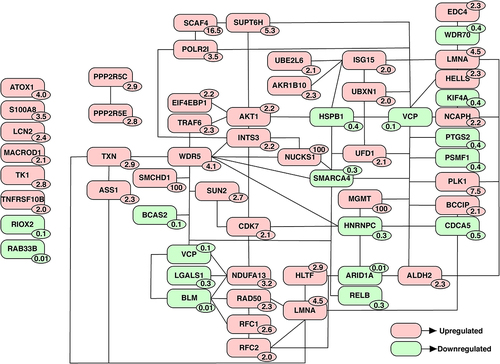
Table 2. Partial list of proteins involved in DNA damage response and repair and are differentially expressed upon cisplatin treatment.
Figure 3. Pathway enrichment analysis of proteins altered in response to cisplatin treatment was carried out using ClueGo plugin in Cytoscape. This analysis revealed enrichment of proteins implicated translation, mRNA splicing and DNA damage bypass pathways among others to be enriched upon cisplatin treatment. Proteins highlighted in red indicates upregulation and downregulated proteins are in green.
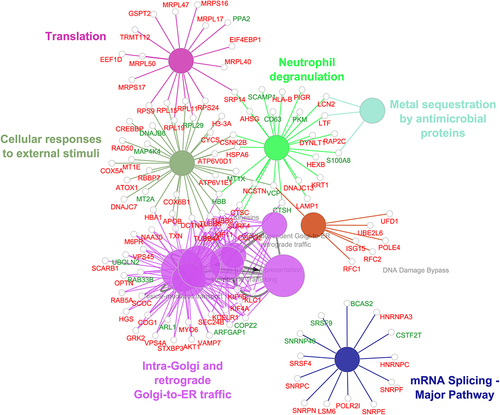
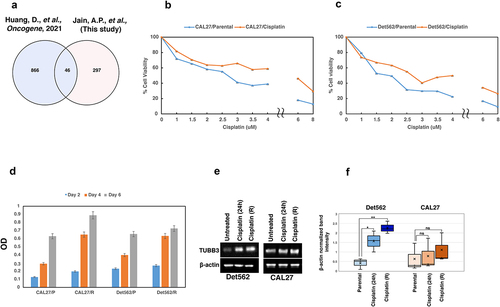
Figure 4. (a) Venn diagram showing the list of proteins that were common between this study and proteins associated with platinum resistance. (b-c) Development of cisplatin resistant cell lines. CAL27 and Det562 cells were treated with cisplatin at their IC50 for 3 months. The IC50 of both the cells were found to increase with chronic cisplatin treatment indicating acquisition of resistant phenotype. (d) CAL27 and Det562 cisplatin resistant cells exhibited higher cellular proliferation rate compared to untreated or parental cell lines; ((e-f)) Expression of TUBB3 in untreated and cisplatin treated CAL27 and Det562. TUBB3 was found to be overexpressed in cells exposed to cisplatin compared to untreated cells. Cisplatin resistant cells (R) also showed a higher expression of TUBB3 compared to cells treated with cisplatin for 24 h. The expression of TUBB3 was found to be statistically significant in Det562 cells. β- actin was used as loading control.