
Figures & data
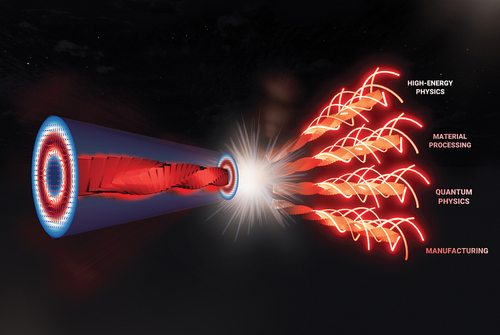
Figure 1. A collage of figures depicting various design approaches for intra-cavity scalar beam creation. These methods include annular optical pumping of solid-state crystals [Citation40–44], laser mode control through cavity design [Citation45–47], direct system-on-chip (SoC) OAM emitters [Citation48,Citation49], vertical-external-cavity surface-emitting (VECSEL) OAM lasers [Citation50,Citation51], complex laser emission using digital micro-mirror devices for optical pump profile control [Citation52], and degenerate ray-wave emission through off-axis optical pumping [Citation53].
![Figure 1. A collage of figures depicting various design approaches for intra-cavity scalar beam creation. These methods include annular optical pumping of solid-state crystals [Citation40–44], laser mode control through cavity design [Citation45–47], direct system-on-chip (SoC) OAM emitters [Citation48,Citation49], vertical-external-cavity surface-emitting (VECSEL) OAM lasers [Citation50,Citation51], complex laser emission using digital micro-mirror devices for optical pump profile control [Citation52], and degenerate ray-wave emission through off-axis optical pumping [Citation53].](/cms/asset/67318fe5-5689-4974-b119-7e7b4956d51d/tapx_a_2327453_f0001_oc.jpg)
Figure 2. (a) Experimental setup for generating an optical vortex from the laser reported in ref [Citation47]. (b) A photograph of the output coupler inscribed with round patterns, as well as a photograph and micrograph of the round patterns. (c) Beam profiles of the generated vortices for various topological charges. (d) The cylindrical lens mode converter and the accompanying HG beam profile. Adapted with permission from Ref. [Citation47].
![Figure 2. (a) Experimental setup for generating an optical vortex from the laser reported in ref [Citation47]. (b) A photograph of the output coupler inscribed with round patterns, as well as a photograph and micrograph of the round patterns. (c) Beam profiles of the generated vortices for various topological charges. (d) The cylindrical lens mode converter and the accompanying HG beam profile. Adapted with permission from Ref. [Citation47].](/cms/asset/1274e83e-c633-46e7-894a-647a3f002a1a/tapx_a_2327453_f0002_oc.jpg)
Figure 3. (a) The Nd:YVO4 crystal vortex cavity laser setup. (b) The average output vortex laser power versus absorbed pump power in pulsed operation at 150 kHz Q-switching rate (black) and in continuous wave (CW) operation (red). Adapted with permission from ref [Citation45].
![Figure 3. (a) The Nd:YVO4 crystal vortex cavity laser setup. (b) The average output vortex laser power versus absorbed pump power in pulsed operation at 150 kHz Q-switching rate (black) and in continuous wave (CW) operation (red). Adapted with permission from ref [Citation45].](/cms/asset/1e08c5a8-b5c9-4c72-8056-9e2c35041eec/tapx_a_2327453_f0003_oc.jpg)
Figure 4. A collage of figures depicting design approaches for intra-cavity vectorial OAM beam creation. These systems include annular optical pumping of anisotropic solid-state crystals and single crystal fibers [Citation66–70], manipulation of the spatial, phase and polarization properties of cavity emission in solid-state [Citation71–76] and fiber lasers [Citation77,Citation78] using various control mechanisms.
![Figure 4. A collage of figures depicting design approaches for intra-cavity vectorial OAM beam creation. These systems include annular optical pumping of anisotropic solid-state crystals and single crystal fibers [Citation66–70], manipulation of the spatial, phase and polarization properties of cavity emission in solid-state [Citation71–76] and fiber lasers [Citation77,Citation78] using various control mechanisms.](/cms/asset/ae9408a7-f8ee-42e2-8fd1-2f4a12c2085a/tapx_a_2327453_f0004_oc.jpg)
Figure 5. (a) Experimental setup whereby the HR mirror was replaced with a GWH to generate a radially polarized beam. (b) The laser performance comparing the grating output coupler generation and (c) the experimental beam profiles obtained with the grating output coupler. Adapted with permission from ref [Citation72,Citation83].
![Figure 5. (a) Experimental setup whereby the HR mirror was replaced with a GWH to generate a radially polarized beam. (b) The laser performance comparing the grating output coupler generation and (c) the experimental beam profiles obtained with the grating output coupler. Adapted with permission from ref [Citation72,Citation83].](/cms/asset/3fc454f6-068b-4da3-b25b-0ec3c0ab12a3/tapx_a_2327453_f0005_oc.jpg)
Figure 6. (a) Concept of the metasurface (J-plate) laser cavity with (b) corresponding produced states displayed on the generalised OAM sphere, with OAM orders (north pole) and
(south pole), illustrating lasing across differing OAM values as superpositions. Adapted with permission from ref [Citation75].
![Figure 6. (a) Concept of the metasurface (J-plate) laser cavity with (b) corresponding produced states displayed on the generalised OAM sphere, with OAM orders ℓ=10 (north pole) and ℓ=100 (south pole), illustrating lasing across differing OAM values as superpositions. Adapted with permission from ref [Citation75].](/cms/asset/cf124698-fb27-4c51-9571-a038f5444a6e/tapx_a_2327453_f0006_oc.jpg)
Figure 7. A collage of figures depicting the various approaches for producing extra-cavity scalar OAM beams. These methods include utilizing transmissive or refractive spiral-phase elements [Citation87–92], through power scaling with an amplifier [Citation93], or by employing dynamic phase modulation techniques and modern technologies [Citation94–100].
![Figure 7. A collage of figures depicting the various approaches for producing extra-cavity scalar OAM beams. These methods include utilizing transmissive or refractive spiral-phase elements [Citation87–92], through power scaling with an amplifier [Citation93], or by employing dynamic phase modulation techniques and modern technologies [Citation94–100].](/cms/asset/e4aedb73-7cc0-4589-91d7-1443f71941d3/tapx_a_2327453_f0007_oc.jpg)
Figure 8. (a) The experimental setup for the mode cleaner cavity. (b) The mode purity for the beam transmitted by the mode cleaner and the fraction of the injected light power which is transmitted from the mode cleaner with intensity profiles of the 83 W LG beam transmitted by the mode cleaner. Adapted with permission from Ref. [Citation92].
![Figure 8. (a) The experimental setup for the mode cleaner cavity. (b) The mode purity for the beam transmitted by the mode cleaner and the fraction of the injected light power which is transmitted from the mode cleaner with intensity profiles of the 83 W LG 33 beam transmitted by the mode cleaner. Adapted with permission from Ref. [Citation92].](/cms/asset/26a6e9fe-9c92-4064-94a6-62c7aa139b59/tapx_a_2327453_f0008_oc.jpg)
Figure 9. A series of OAM modes generated with an intense laser and SPMs contained as inserts for (a) 500, (b) 1 000
and (c) 10 000
. Adapted with permission from Ref. [Citation91].
![Figure 9. A series of OAM modes generated with an intense laser and SPMs contained as inserts for (a) 500ℏ, (b) 1 000ℏ and (c) 10 000ℏ. Adapted with permission from Ref. [Citation91].](/cms/asset/6e99886a-2c1b-4ed6-baeb-dbfa79c3e15f/tapx_a_2327453_f0009_oc.jpg)
Figure 10. A collage of figures depicting various approaches for creating extra-cavity vectorial OAM beams. These methods include utilizing anisotropic crystal properties during solid-state and fiber amplification [Citation105–109], interferometric configurations for dynamic selection of vector polarization distributions [Citation110–114], and static phase elements for mode creation [Citation115–117].
![Figure 10. A collage of figures depicting various approaches for creating extra-cavity vectorial OAM beams. These methods include utilizing anisotropic crystal properties during solid-state and fiber amplification [Citation105–109], interferometric configurations for dynamic selection of vector polarization distributions [Citation110–114], and static phase elements for mode creation [Citation115–117].](/cms/asset/8cf3af38-125a-4cec-9e90-354e1b8c2cf0/tapx_a_2327453_f0010_oc.jpg)
Figure 11. The Yb:YAG single-crystal fiber amplifier setup (left). Intensity images of the amplified beam for radial (right, top) and azimuthal polarization (right, bottom) with accompanying intensity images for analyzer rotation angles. Adapted with permission from Ref. [Citation105].
![Figure 11. The Yb:YAG single-crystal fiber amplifier setup (left). Intensity images of the amplified beam for radial (right, top) and azimuthal polarization (right, bottom) with accompanying intensity images for analyzer rotation angles. Adapted with permission from Ref. [Citation105].](/cms/asset/d17262b0-76c1-4918-9313-01d94e0154f4/tapx_a_2327453_f0011_oc.jpg)
Figure 12. Experimental setup for the incorporation of a metasurface (MS) for the conversion from linear to radial polarization (top, left). Photo and space-varying optical axis directions of the metasurface (bottom, left). Various intensity images of the produced radially polarized cylindrical vector beams after passing through a Glan laser prism at different output powers (right). Adapted with permission from Ref. [Citation116].
![Figure 12. Experimental setup for the incorporation of a metasurface (MS) for the conversion from linear to radial polarization (top, left). Photo and space-varying optical axis directions of the metasurface (bottom, left). Various intensity images of the produced radially polarized cylindrical vector beams after passing through a Glan laser prism at different output powers (right). Adapted with permission from Ref. [Citation116].](/cms/asset/622ee439-a48f-4d4a-877f-fffbccaa022a/tapx_a_2327453_f0012_oc.jpg)
Figure 13. A logarithmic scale plot highlighting significant advances in the generation of scalar and vector OAM beams in the high peak power and ultrashort pulse duration regimes. (a) Laser focal spots measured without and with a spiral phase plate placed in the path of a ϕ = 25 mm diameter laser beam with corresponding spectrally resolved high-order harmonic 1D angular profiles. (b) Setup of a the few-cycle vortex beam generation experiment with a 1.8 µm laser source and corresponding polarization measurements of the radially polarized beam. (c) Experimental setup of the CVB generation process with femtosecond pulses at 1030 nm, together with a S-waveplate to transform Gaussian-shaped beam into donut-shaped beam and corresponding simulated intensity profiles of CVBs. (d) Experimental setup for the generation of femtosecond optical vortex beams with megawatt powers from a fiber based mamyshev oscillator. (e) The setup for a picosecond YDF-MOPA for amplifying radially polarized beams and corresponding radially polarized beams generated by a q-plate. (f) The setup for a thin-disk multipass amplifier which delivers linearly polarized pulses subsequently converted to azimuthal polarization which is later amplified to kW-levels. Adapted with permission from refs: (a) [Citation118], (b) [Citation119], (c) [Citation120], (d) [Citation121], (e) [Citation122], (f) [Citation123].
![Figure 13. A logarithmic scale plot highlighting significant advances in the generation of scalar and vector OAM beams in the high peak power and ultrashort pulse duration regimes. (a) Laser focal spots measured without and with a spiral phase plate placed in the path of a ϕ = 25 mm diameter laser beam with corresponding spectrally resolved high-order harmonic 1D angular profiles. (b) Setup of a the few-cycle vortex beam generation experiment with a 1.8 µm laser source and corresponding polarization measurements of the radially polarized beam. (c) Experimental setup of the CVB generation process with femtosecond pulses at 1030 nm, together with a S-waveplate to transform Gaussian-shaped beam into donut-shaped beam and corresponding simulated intensity profiles of CVBs. (d) Experimental setup for the generation of femtosecond optical vortex beams with megawatt powers from a fiber based mamyshev oscillator. (e) The setup for a picosecond YDF-MOPA for amplifying radially polarized beams and corresponding radially polarized beams generated by a q-plate. (f) The setup for a thin-disk multipass amplifier which delivers linearly polarized pulses subsequently converted to azimuthal polarization which is later amplified to kW-levels. Adapted with permission from refs: (a) [Citation118], (b) [Citation119], (c) [Citation120], (d) [Citation121], (e) [Citation122], (f) [Citation123].](/cms/asset/9233f581-35d8-4c36-b4ec-ee85c690197c/tapx_a_2327453_f0013_oc.jpg)
Figure 14. (a) The layout for the formation of a single output beam from a seed laser which follows a series of split-amplify stages that are are finally combined from the civan laser system, with corresponding intensity profile.(b) nLIGHT® fibre profile and corresponding near-field spatial profiles images when light is guided through the various cores or for two different fibre designs (bottom and top rows). (c) The mode analysis system implementing multiplexed holographic phase masks and the intensity profiles of a theoretical and experimental LG diffracted by the HPM 100 W and 1000 W beams, respectively. Adapted with permission from refs: (a) [Citation146], (b) [Citation147], (c) [Citation148].
![Figure 14. (a) The layout for the formation of a single output beam from a seed laser which follows a series of split-amplify stages that are are finally combined from the civan laser system, with corresponding intensity profile.(b) nLIGHT® fibre profile and corresponding near-field spatial profiles images when light is guided through the various cores or for two different fibre designs (bottom and top rows). (c) The mode analysis system implementing multiplexed holographic phase masks and the intensity profiles of a theoretical and experimental LG 08 diffracted by the HPM 100 W and 1000 W beams, respectively. Adapted with permission from refs: (a) [Citation146], (b) [Citation147], (c) [Citation148].](/cms/asset/561834ad-11ef-411b-b52d-678406e56e7b/tapx_a_2327453_f0014_oc.jpg)
Figure 15. Applications of high-power structured light beams are highly diverse, with some examples shown here covering laser materials processing [Citation149,Citation150], optical communication [Citation151,Citation152] and micro-fabrication [Citation153–157].
![Figure 15. Applications of high-power structured light beams are highly diverse, with some examples shown here covering laser materials processing [Citation149,Citation150], optical communication [Citation151,Citation152] and micro-fabrication [Citation153–157].](/cms/asset/e8f2fc0d-0936-453d-b6d9-ea8d63a15acf/tapx_a_2327453_f0015_oc.jpg)
Figure 16. SEM images of transverse sections, inlets and outlets of microholes in 1 mm CrNi steel drilled with radially (left) and azimuthally (right) polarized radiation. Adapted with permission from Ref. [Citation156].
![Figure 16. SEM images of transverse sections, inlets and outlets of microholes in 1 mm CrNi steel drilled with radially (left) and azimuthally (right) polarized radiation. Adapted with permission from Ref. [Citation156].](/cms/asset/ac8c58a7-131e-4c26-b6e4-c853758a5b76/tapx_a_2327453_f0016_oc.jpg)
Figure 17. SEM images of the structures formed on Ni surfaces upon irradiation with azimuthal (left) and radial (right) polarized vector vortex beams. Adapted with permission from Ref. [Citation154].
![Figure 17. SEM images of the structures formed on Ni surfaces upon irradiation with azimuthal (left) and radial (right) polarized vector vortex beams. Adapted with permission from Ref. [Citation154].](/cms/asset/494eb190-2f8b-4884-a30b-c63ad256cbda/tapx_a_2327453_f0017_oc.jpg)
Figure 18. (a) SEM image of a cleaved edge of a (b) Glass. Detail of the cleaved surface and its corresponding (c) Surface-roughness measurement with (d) Corresponding transverse intensity profile. Adapted with permission from Ref. [Citation157].
![Figure 18. (a) SEM image of a cleaved edge of a (b) Glass. Detail of the cleaved surface and its corresponding (c) Surface-roughness measurement with (d) Corresponding transverse intensity profile. Adapted with permission from Ref. [Citation157].](/cms/asset/5567e966-c013-4610-b593-0e2bdd7566fc/tapx_a_2327453_f0018_oc.jpg)
Figure 19. Application scenario for high-speed and high-capacity underwater optical communication with high-power OAM-based SDM. Adapted with permission from Ref. [Citation152].
![Figure 19. Application scenario for high-speed and high-capacity underwater optical communication with high-power OAM-based SDM. Adapted with permission from Ref. [Citation152].](/cms/asset/e2dc0c6c-5657-4920-85f5-3e03dc501238/tapx_a_2327453_f0019_oc.jpg)