Figures & data
Figure 1. Aachen’s location in the state of North Rhine-Westphalia, Western Germany (Source: Wikimedia commons).
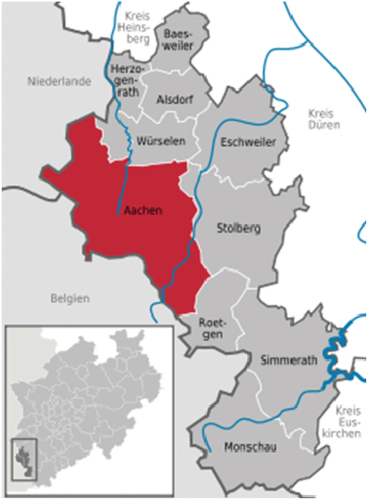
Figure 2. Flowchart of the study.
Table 1. Interview topics and emerging themes.
Figure 3. Urban vs outdoor person.
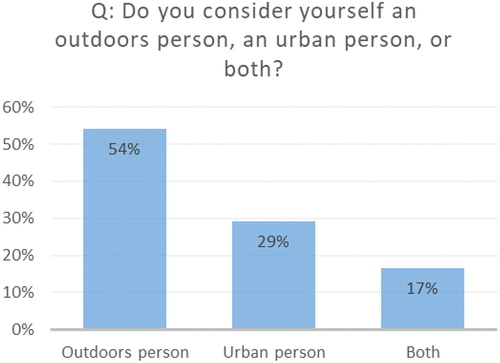
Figure 4. Value of natural landscape.
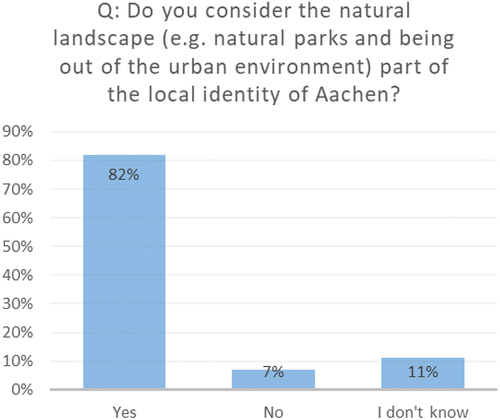
Figure 5. Reasons for choosing places in Aachen (Note: in this question each respondent could nominate up to three activities, hence the numbers higher than the total of 72 respondents).
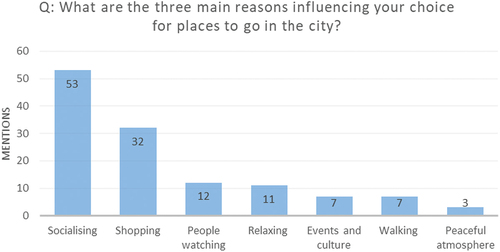
Figure 6. Main recreational activities developed in Aachen’s public open spaces (Note: in this question each respondent could nominate up to three activities, hence the numbers higher than the total of 72 respondents).
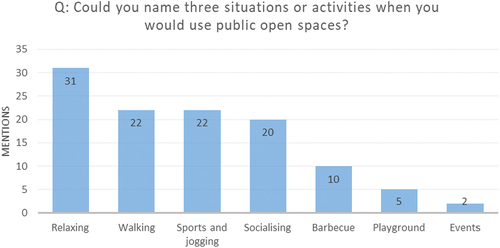
Figure 7. Most desirable characteristics of the urban environment (Note: in this question each respondent could nominate up to three activities, hence the numbers higher than the total of 72 respondents).
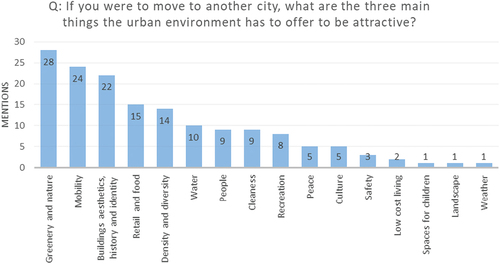
Figure 8. Aachen urban environment.
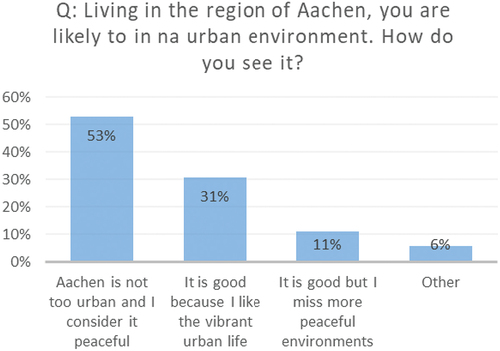
Figure 9. Urban places main attraction (Note: in this question respondents ranked each one of the features of urban spaces from 1 to 5. The result shown on the graph is the numerical sum of all responses for each feature, hence the total numbers are higher than the total of 72 respondents).
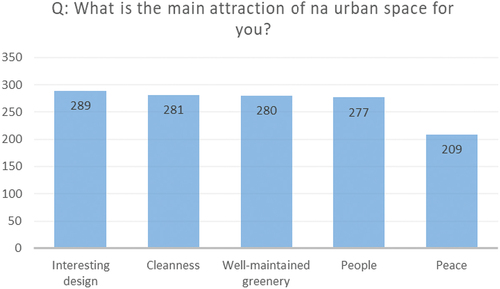
Figure 10. People in public spaces and choices for places.
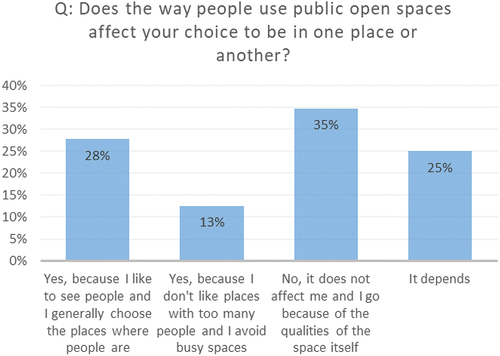
Figure 11. Main characteristics of Aachen weather.
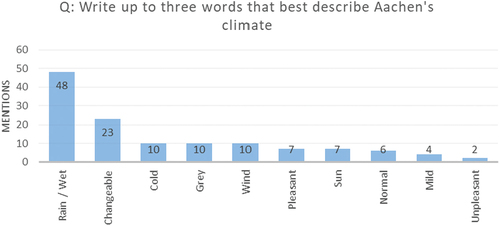
Figure 12. Routine changes due to weather (Note: in this question respondents could choose all responses that applied to their circumstances. The result shown on the graph is the numerical sum of all responses for each response option, hence the total numbers are higher than the total of 72 respondents).
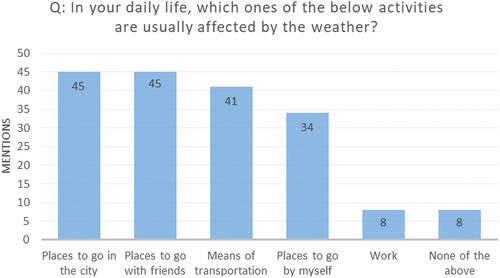
Figure 13. Main weather factors influencing routine.
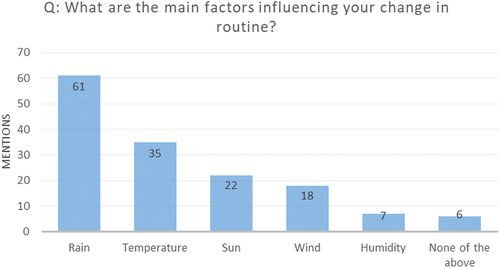
Figure 14. Considerations for choosing clothing.
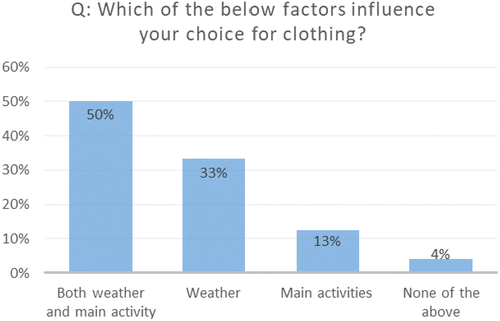
Figure 15. Main weather factors influencing clothing choice.
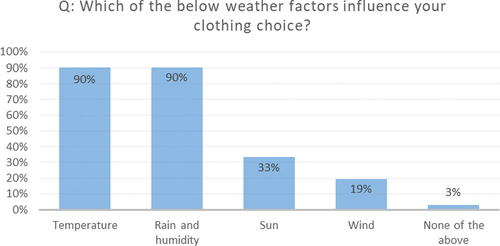
Figure 16. Aachen urban comfort.