
Figures & data
Figure 1. Distribution of faults between 2006–2020.
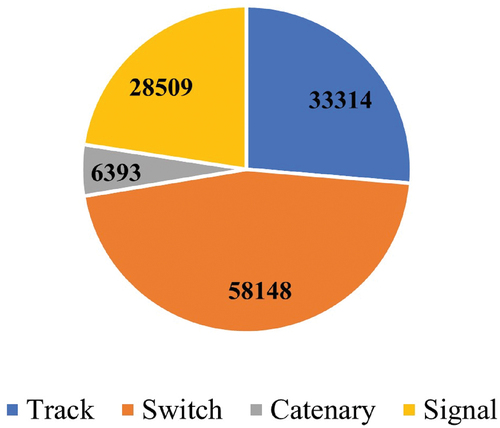
Table 1. Fault Examples.
Table 2. Top five reasons for faults of six different track components.
Table 3. Overview of weather variables, collected between 2006 and 2020.
Figure 2. Distribution of railway stations amongst the Köppen-Geiger climate zones (adapted from Beck, Zimmermann, McVicar, et al. (Citation2018), the Swedish Transport Administration, and the University of Texas). Top right subset map to highlight climate zone Cfb.
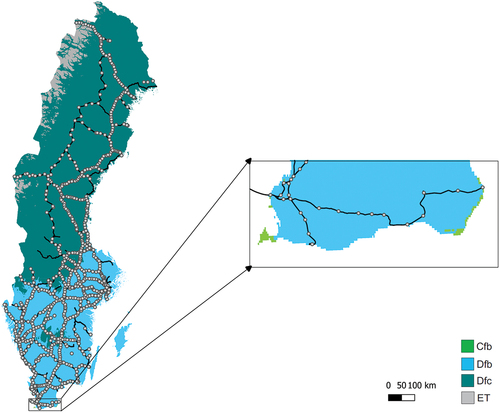
Figure 3. Distribution of weather stations amongst the Köppen-Geiger climate zones (adapted from Beck, Zimmermann, McVicar, et al. (Citation2018), the Swedish Meteorological and Hydrological Institute, and the University of Texas).
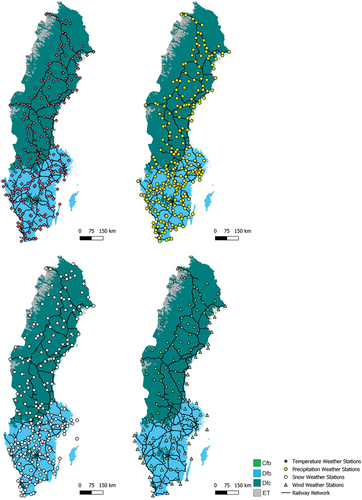
Table 4. Number of railway stations in each climate zone.
Table 5. Overview of the variables used for the analysis.
Table 6. Sample size bins for each weather variable.
Figure 4. Example of fault rate with lower bound for switches and temperature (°C).
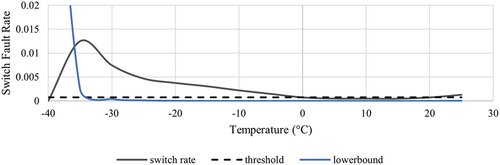
Figure 5. Fault rates for switches, signals, tracks, and catenaries and daily average temperature (°C).
Figure 6. Fault rates for switches, signals, tracks, and catenary and daily average precipitation (mm).
Figure 7. Fault rates for switches, signals, tracks, and catenaries and daily average snow depth (cm).
Figure 8. Fault rates for switches, signals, tracks, and catenaries and daily maximum wind speed (m/s).
Table 7. Summary of relationships being carried to Section 5, where ‘X’ indicates a determined relationship.
Table 8. Summary of results regarding the thresholds of significant fault rates.
Figure 9. Fault rates for switches, tracks, and catenaries and daily average temperature (°C) between climate zones Dfb and Dfc.
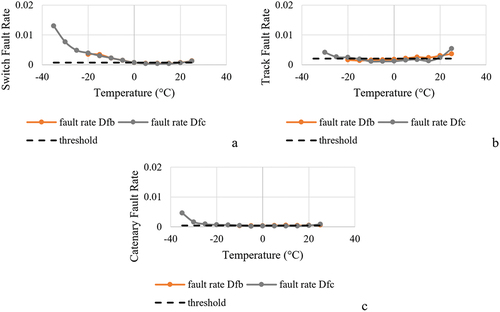
Figure 10. Fault rates for tracks and catenaries and daily average precipitation (mm) between climate zones Dfb and Dfc.
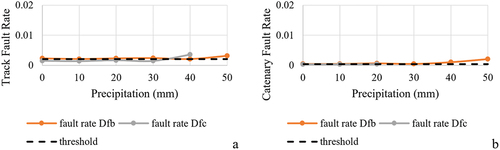
Figure 11. Fault rates for switches and tracks and daily average snow depth (cm) between climate zones Dfb and Dfc.
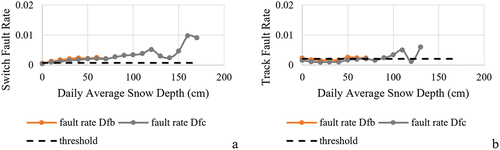
Figure 12. Fault rates for tracks and catenaries and daily maximum wind speed (m/s) between climate zones Dfb and Dfc.
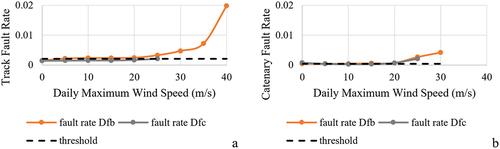
Table 9. Summary of results regarding the differences in asset vulnerability between climate zones. Where ‘–’ indicates the relationships not carried forward in this analysis and ‘X’ indicates a strong difference between climate zones.
Table 10. Summary of results regarding differences in thresholds between climate zones.
Revised Appendix A Sensitivity Analysis.docx
Download MS Word (2.7 MB)Revised Appendix B Detailed Results.docx
Download MS Word (1.9 MB)Data availability statement
Datasets are available from the corresponding author upon reasonable request.