
Figures & data
Figure 1. The sustainable port as a transport node, energy node, and digital node (Lind et al. Citation2021a; Illustration: Sandra Haraldson).

Figure 2. System overview.
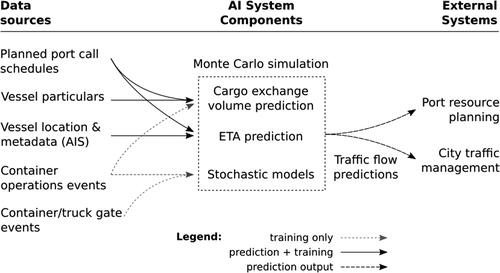
Figure 3. Distribution of times from vessel arrival to container discharge ().
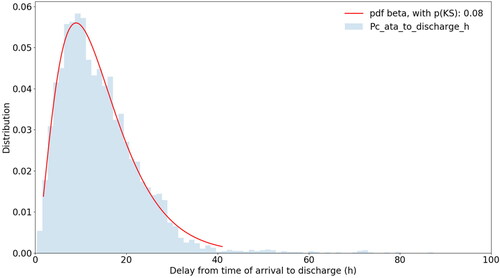
Figure 4. Distribution of times from container discharge to gate exit ().
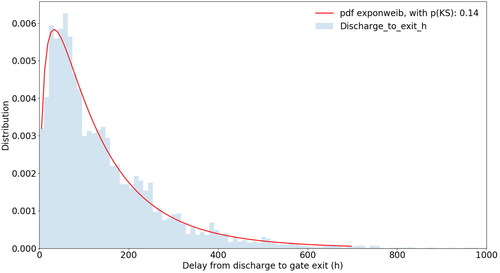
Figure 5. Kernel density estimates of the empirical distributions of actual and simulated total container dwell times in the port of Valencia.
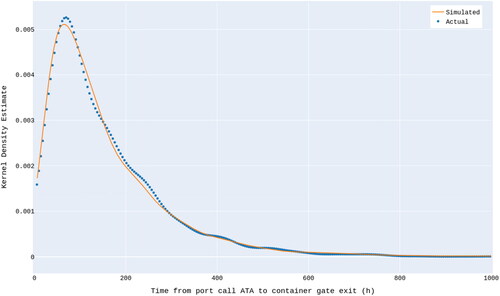
Figure 6. Simulated vs. actual weekly numbers of containers leaving Port of Valencia by truck.
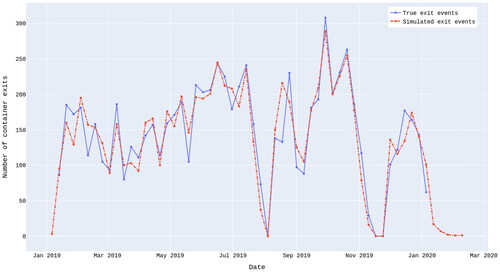
Figure 7. Feature importance histogram of the features used in predicting the number of containers to be discharged per port call. ‘EstortCallDurationHours’ is the estimated port call duration as reported in advance for each port call, and ‘vesselGT’ is the gross tonnage of the vessel.
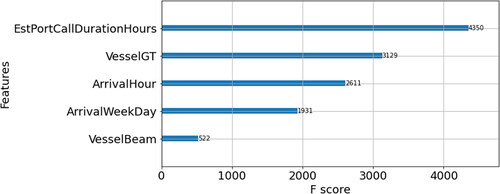
Figure 8. Histogram of prediction error for the example regression model predicting the numbers of containers discharged per vessel. The mean absolute prediction error is 39, with standard deviation 52, and median 21. The mean number of containers discharged per port call in the dataset was 101, with standard deviation 151.
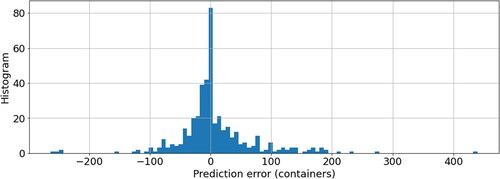
Figure 9. Relative prediction error per week for the Monte Carlo model using true container discharge numbers (blue bars) vs. applying container discharge numbers predicted by an XGBoost regression model (orange bars). The median absolute relative error using the true container numbers was 12.6%, while using the predicted container numbers this was 24.2%. The latter also produces more significant outliers in the predicted weekly traffic rates.
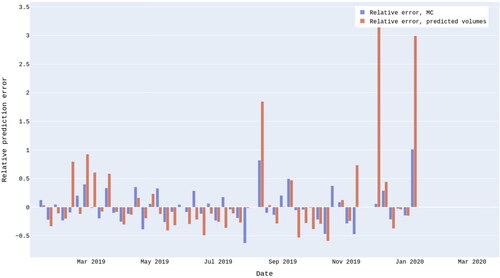
Figure 10. Cumulative distribution of estimated voyage durations for container arrivals to Port of Valencia.
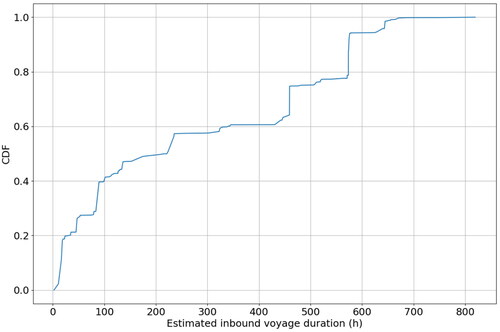
Figure 11. Actual distribution of exit events by hour of the day compared with a hypothetical scenario where the port is open 24 hours a day.
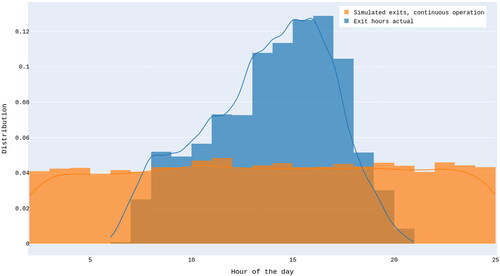
Figure 12. Daily event rates from observation data, simulations, and simulations assuming continuous operation of the port.
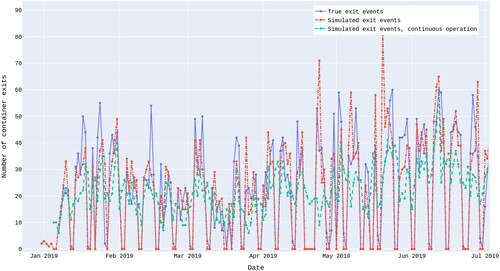
Table 1. Comparison of statistics for daily exit event numbers for true traffic, simulated traffic with actual port operation days, and simulated traffic for a hypothetical scenario where the port is operating seven days a week. Only active days are included in the statistics.