Figures & data
Figure 1. Mean swimlatency calculated on the first and fourth day of the acquisition phase of Morris water maze test for all groups. Error bars denote SEM. The degree of significance is denoted as * for p ≤ 0.05.
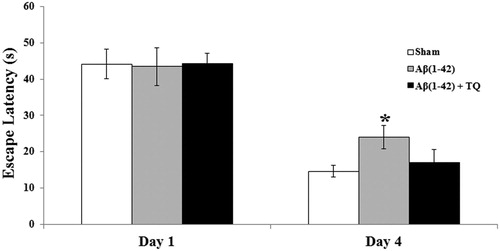
Figure 2. The concentrations of selected inflammatory markers (A) IFN-γ (B) IL-1α (C) IL-1β (D) TNF-α.which were measured by Magnetic Luminex system for all groups. Error bars denote SEM. The degree of significance is denoted as * for p ≤ 0.05.
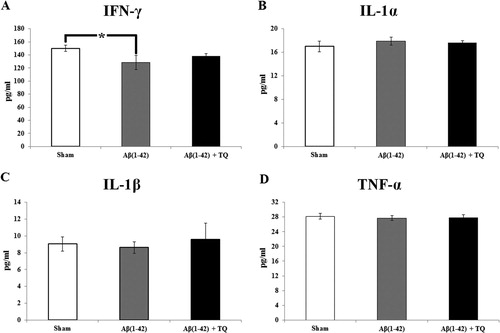
Table 1. The results of Pearson's correlation of the levels of IFN-γ, IL-1α, IL-1β and TNF-α with each other among sham, Aβ(1–42) and Aβ(1–42) + TQ groups.
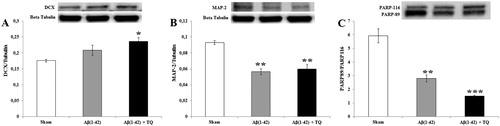
Figure 3. Representative pictures and relative amounts of (A) DCX to beta tubulin (B) MAP-2 to beta tubulin, and (C) PARP 89/116protein expressions analyzed by Western blot for all groups. Error bars indicate SEM. The degree of significance is denoted as * for p ≤ 0.05, ** for p ≤ 0.01, and *** for p ≤ 0.001.