
Figures & data
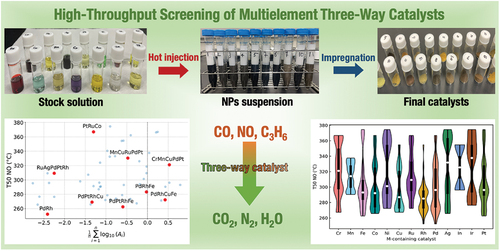
Figure 1. Illustrations of the NPs synthesis process: (a) individual metal precursor solutions, (b) pretreating a TEG/PVP solution, (c) heating TEG/PVP solutions at 200 °C, (d) reaction setup with two syringes for a mixed metal solution and a reducing agent, and (E) obtained NPs suspensions.
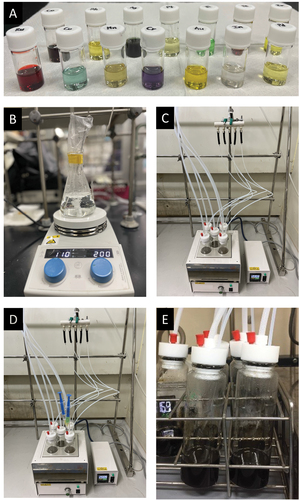
Figure 2. Illustrations of the catalyst synthesis process: (a) immpregnation of NPs on catalysts supports, (b) parallel impregnation setup, (c) drying and calcination in an oven, and (d) obtained catalysts.
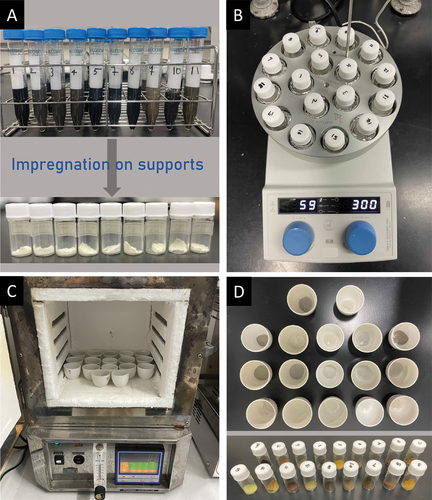
Figure 3. Incorporation of individual elements in the synthesized NPs (figure created with [Citation33]).
![Figure 3. Incorporation of individual elements in the synthesized NPs (figure created with [Citation33]).](/cms/asset/7ff2ba7b-4943-4433-8160-9f8c70ed168c/tstm_a_2284130_f0003_oc.jpg)
Figure 4. Representative TEM images of prepared NPs.
Figure 5. (a) histogram of the average size for all the synthesized NPs (figure created with [Citation34]) and (b) violin plots representing the distribution of the average size for NPs containing a specific element (figure created with [Citation33]).
![Figure 5. (a) histogram of the average size for all the synthesized NPs (figure created with [Citation34]) and (b) violin plots representing the distribution of the average size for NPs containing a specific element (figure created with [Citation33]).](/cms/asset/3eb566ca-94a7-4ef2-8149-aeee4d9aa7eb/tstm_a_2284130_f0005_oc.jpg)
Figure 6. Screening results for TWC (figure created with [Citation34]).
![Figure 6. Screening results for TWC (figure created with [Citation34]).](/cms/asset/78d690d2-454b-4b25-a6e6-0dcd2280b5c9/tstm_a_2284130_f0006_oc.jpg)
Figure 7. Relationship between the T50 of NO and the earth abundance of the MNPs design. The earth abundance of a design is derived as an average of scaled abundance of individual elements (figure created with [Citation34]).
![Figure 7. Relationship between the T50 of NO and the earth abundance of the MNPs design. The earth abundance of a design is derived as an average of scaled abundance of individual elements (figure created with [Citation34]).](/cms/asset/b68f8d79-a2ce-4cd3-a2f0-b69740cf6901/tstm_a_2284130_f0007_oc.jpg)
Supplemental Material
Download PDF (3.2 MB)Data availability statement
The authors confirm that the data supporting the findings of this study are available within the article and its supplementary materials.