
Figures & data
Table 1: Chromosomal fragile sites (CFSs) information.
Figure 1: Frequency of deletions (top left) and duplications (bottom left) and observed deletion proportion by CFS (right).
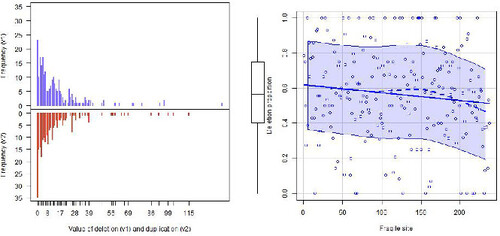
Table 2: Statistical inference for logistic regression model (Wald test p-value
)–Part one.
Table 3: Statistical inference for logistic regression model (Wald test p-value
)–Part two.
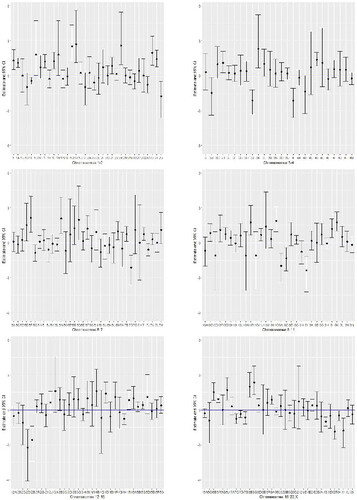
Figure 2: Chromosomal fragile site effects in the log-odds of deletion: estimates and 95% confidence intervals (CI).
Data availability statement
The data that support the findings of this study are available from the corresponding author, [Prata Gomes], upon reasonable request.