
Figures & data
Figure 1. Study area map: surveyed districts and villages overlaid on agroecological zones.
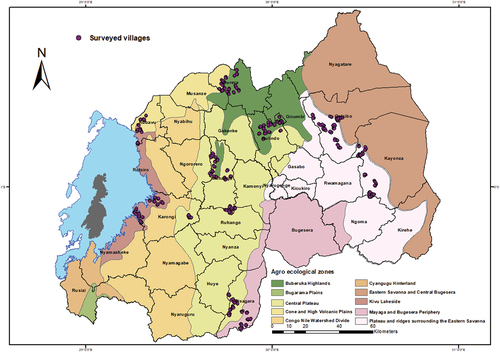
Table 1. Main characteristics of studied districts (NISR, Citation2017.).
Figure 2. PCA scree plot (A), the optimal number of clusters (B) cluster dendrogram (C), and clustering results on a factor map (D).
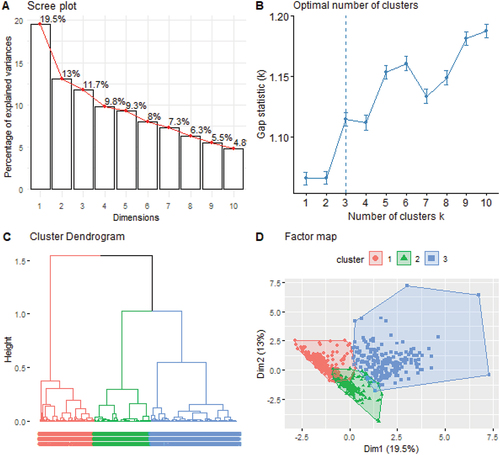
Table 2. Correlation matrix between principal components and variables used.
Table 3. Cluster (farm types) descriptions and naming.
Table 4. Log odds and standard error (in parentheses) for the binary logistic regression model for adoption of BXW prevention and control innovations by farm types.
Table 5. Alternatives to one-size-fits-all policies for BXW management in Rwanda.
Table A1. Descriptive statistics of clusters.