Figures & data
Table 1. Classification of parasitic protists and associated diseases
Figure 1. Life-cycle of pathogenic protists: Leishmania spp., T. brucei, T. cruzi, T. gondii, and Plasmodium spp. The figure shows the parasitic forms found in trypanosomatid and apicomplexan protists during their life-cycle. The main host cells targeted by these protists, the organs affected by the infections, and the vector that transmit them are depicted. Created with BioRender.com.
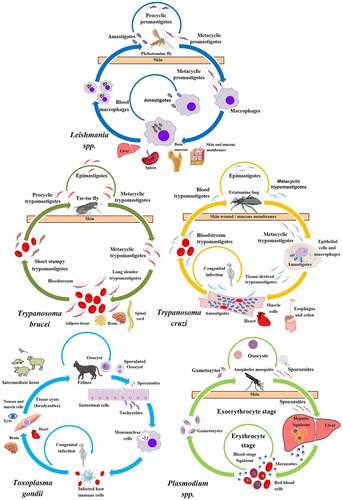
Figure 2. Mechanism of Autophagy. (A) The five steps of the autophagy pathway. 1. Induction/Nucleation begins with the recruitment of ATG induction complex factors (Pink) followed by PtdIns3K complex factors (Purple), recruited to interact with the ATG induction complex. 2. The Elongation step commences by the Ubiq-like complex formation (Green) to conjugate ATG8 proteins to PE through the LC3 Complex factors (Blue) which are recycled by the action of ATG4. This step undergoes elongation of the autophagosome. 3. Completion of autophagosome takes place with insertion of ATG8-PE to vesicle formed and final release with aid of ATG4 to deconjugate ATG8 from PE followed by the 4. Fusion of the autophagosome to the lysosome via several protein factors including Rap7, Ypt7p, and HOPS. 5. Degradation takes place after fusion, the inner membrane of the autophagolysosome is degraded by the action of ATG15 and other proteases. Autophagy is complete with the efflux of degraded proteins (basic molecules and amino acids) into the cytoplasm through the ATG22 efflux pump. (B) Schematic representation of the autophagy complexes and the Atg proteins that compose them.
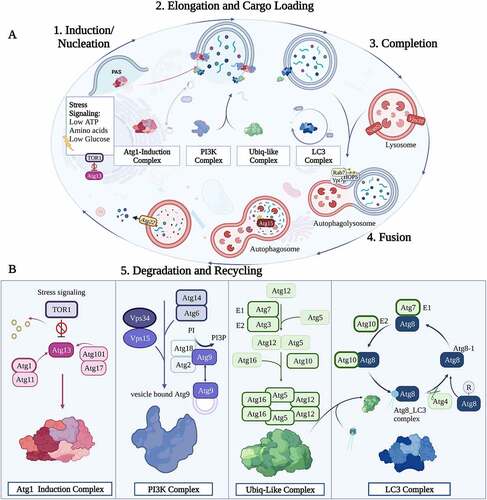
Figure 3. Conservation of the core autophagy proteins in selected parasitic protists. A Coulson plot [Citation459] was generated to indicate the presence (color) or absence (white) of a homologous protein to the machinery described in yeast. Grey coloring indicates that only a distant homology can be found. Asterisks indicate multiple protein homologs.
![Figure 3. Conservation of the core autophagy proteins in selected parasitic protists. A Coulson plot [Citation459] was generated to indicate the presence (color) or absence (white) of a homologous protein to the machinery described in yeast. Grey coloring indicates that only a distant homology can be found. Asterisks indicate multiple protein homologs.](/cms/asset/0e4960df-410c-4475-aace-4ce8bd9d958a/kauo_a_2149211_f0003_oc.jpg)
Figure 4. Lysine depletion triggers autophagy in T. brucei. (A) The images show the formation of autophagosomes using ectopically expressed YFP::TbATG8.2 as an autophagosome marker in parasites upon RNAi of lysine transporter TbAAT16. (B) Images show acidocalcisome acidification (based on the accumulation of LysoTracker Red) in parasites after RNAi of lysine transporter TbAAT16. Upon RNAi of lysine transporter TbAAT16, autophagosome formation and acidocalcisome acidification were observed in fed conditions (A and B, left panels), and these activities increased further upon starvation (A and B, right panels). (C) Cells ectopically expressing YFP::TbATG8.2 were incubated in gHBSS containing all AAs except for the indicated individual AA for 2 h. The autophagosome number was quantified based on YFP::TbATG8.2-positive puncta. The relative autophagy activity (fold change) was normalized against the negative control (gHBSS with full AAs), where few autophagosomes were formed. gHBSS only was used as a positive control.
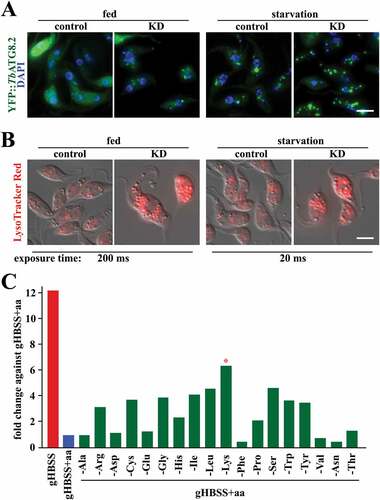
Figure 5. Metamorphosis of sporozoites and microneme elimination by autophagy. (A) Scanning EM on converting P. berghei maintained axenically. Bars, 1 µm. (B) Transmission EM of intrahepatic P. yoelii. Bars, 1 µm. (C) Double IFA using anti-TRAP and PbATG8 antibodies on intrahepatic P. berghei 12 h p.i., showing colocalization. (D) Double IFA using anti-PbATG8 and ACP antibodies on intrahepatic P. berghei 22 h p.i., showing colocalization. (E) ImmunoEM on intrahepatic P. berghei using anti-PbATG8 antibody, showing gold particles on the outermost membranes of the apicoplast (api, arrows). Bars, 100 nm [adapted from 160,164,169]. (F) Hypothetical model for microneme exophagy and amphisome detection (see text for description). (G) Triple IFA using anti-ATG8, anti-GRASP and anti-VPS4 antibodies on intrahepatic P. berghei 22 h p.i., showing significant co-association of ATG8, GRASP and VPS4 on same structures [adapted from 169].
![Figure 5. Metamorphosis of sporozoites and microneme elimination by autophagy. (A) Scanning EM on converting P. berghei maintained axenically. Bars, 1 µm. (B) Transmission EM of intrahepatic P. yoelii. Bars, 1 µm. (C) Double IFA using anti-TRAP and PbATG8 antibodies on intrahepatic P. berghei 12 h p.i., showing colocalization. (D) Double IFA using anti-PbATG8 and ACP antibodies on intrahepatic P. berghei 22 h p.i., showing colocalization. (E) ImmunoEM on intrahepatic P. berghei using anti-PbATG8 antibody, showing gold particles on the outermost membranes of the apicoplast (api, arrows). Bars, 100 nm [adapted from 160,164,169]. (F) Hypothetical model for microneme exophagy and amphisome detection (see text for description). (G) Triple IFA using anti-ATG8, anti-GRASP and anti-VPS4 antibodies on intrahepatic P. berghei 22 h p.i., showing significant co-association of ATG8, GRASP and VPS4 on same structures [adapted from 169].](/cms/asset/70a15fac-66df-438b-a6d5-f1aca27940b7/kauo_a_2149211_f0005_oc.jpg)
Figure 6. Ultrastructural autophagic phenotype of Trypanosoma cruzi triggered by drugs. (A-E) Parasites treated with different classes of drugs shared similar autophagic features such as multiple concentric membranous structures (black arrows) distributed in the cytosol, the presence of endoplasmic reticulum surrounding organelles (white arrows) as well as an intense cytosolic vacuolization (black stars) and mitochondrial swelling (black asterisk). (E) Increased formation of autophagosomes (white star), with distinct levels of cargo degradation is also frequently observed after the stress induction. M: mitochondrion; L: lipid; N: nucleus. Bars = 0.5 µm.
Figure 7. The host autophagy during Leishmania infection. (A) Leishmania major- and L. amazonensis induced autophagy. Both L. amazonensis and L. major induce autophagy in macrophages. L. major activation of autophagy depends on TLR3, 7, and 9, reducing parasite survival inside the host cell. L. major-infected macrophages present a higher percentage of parasitophorous vacuoles labeled with DQ-BSA and earlier loss of LC3-recruited molecules than L. amazonensis-infected macrophages. (B) Leishmania braziliensis-induced autophagy. L. braziliensis infection induces BECN1–Vps34 complex. This parasite also reduces LC3B expression in cutaneous lesion biopsies and a transient decrease in LC3+ cells in L. braziliensis-infected THP-1 compared to uninfected cells. In addition, L. braziliensis reduces the percentage of LC3+ cells and the number of puncta structures after rapamycin or starvation treatment in macrophages. (C) Leishmania donovani-induced autophagy. L. donovani induces high LC3-II to LC3-I ratios in infected THP1 cell-line, human macrophages, and PMNs. This parasite induces non-canonical autophagy in the early stages after infection and canonical autophagy later in PMNs. In macrophages, this parasite induces non-canonical autophagy at later stages of infection and inhibits classical autophagy at both early and late stages, favoring parasite survival. Created with BioRender.com.
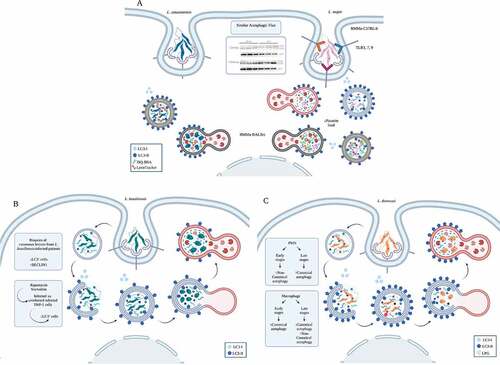
Figure 8. The host autophagy during T. cruzi infection. (A) invasion of tissue cell trypomastigotes (TCT) is characterized by 4 steps, adhesion of parasites to cell surface (step 1), internalización/parasitophorous vacuole formation (step 2), vacuole maturation (step 3) and exit of parasites to cytosol by vacuole membrane disruption (step 4). TCT vacuole is decorated with LC3 and infection increase in pre-starved cells by favoring the vacuole maturation. (B) MT invasion is characterized by plasma membrane wounding and lysosomal exocytosis. Starvation of cells favors infection of MT by increasing lysosomal formation and scattering. (C) T. cruzi infection increases autophagosome number. Amastigotes developed at later times of infection inhibit autophagy flux in non-professional phagocytic cells. (D) In professional phagocytic cells (or in cardiac cells treated with autophagy inducers), amastigotes are targeted by xenophagy and destroyed. Created with BioRender.com.
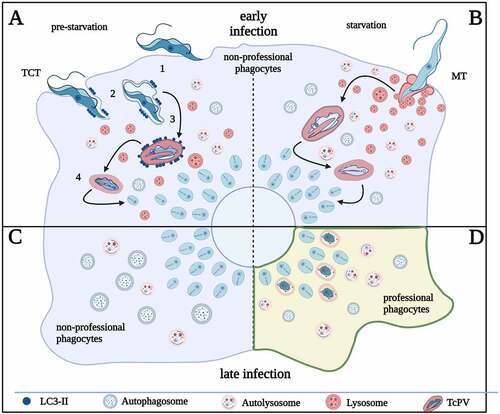
Figure 9. The host autophagic responses during T. gondii infection. (A) activation of host cell autophagy by CD40 stimulus induces the fusion of T. gondii PV with lysosomes followed by parasite destruction. (B) In murine cells, IFN-ɣ induces the recruitment of IRGs and GBPs on the PVM which expose the denuded parasites to destruction by autophagosomes (pathway 1). In human epithelial cells, ISG15 induces the ubiquitination of PVM followed by SQSTM1/p62 and NDP52 mediated LC3 recruitment. Concentric LC3-positive membranes around PV limit parasite replication (pathway 2). In human endothelial cells, ubiquitination and loading of SQSTM1/p62 and NDP52 are followed by Rab7 recruitment and lysosomal fusion leading to parasite destruction (pathway 3). (C) T. gondii resists host cell toxoplasmicidal action by inhibiting selective autophagy via MICs-dependent EGFR activation. Induction of canonical autophagy and lipophagy provide nutrients for T. gondii growth. Created with BioRender.com.
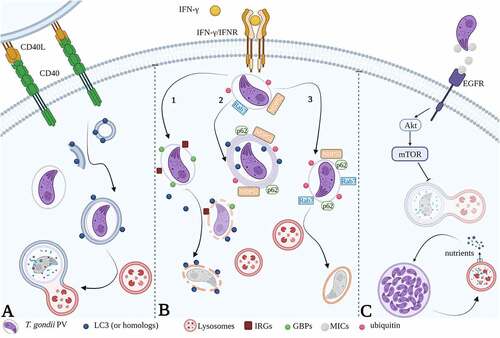
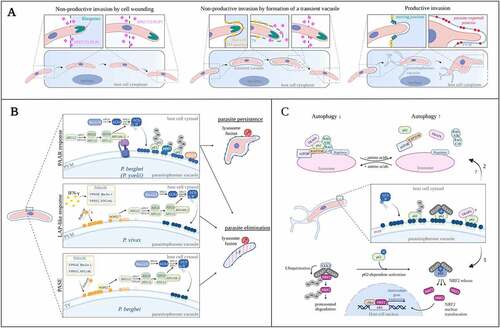
Figure 10. Cell invasion by Plasmodium and autophagy associated host responses. (A) Different types of invasion: non-productive invasion by cell wounding, non-productive invasion by formation of a transient vacuole, and productive invasion. (B) Mechanisms of host response against Plasmodium: the Plasmodium-Associated Autophagy-Related (PAAR) response targeting P. berghei parasites, the LAP-like response against P. vivax parasites, and the PI3P-Associated Sporozoite Elimination (PASE) against P. berghei parasites trapped in a transient vacuole. The molecular components involved in each response were depicted (see text for description). (C) Signaling functions of SQSTM1/p62. Middle panel: SQSTM1/p62 is recruited by LC3 and associates with the parasitophorous vacuole membrane of Plasmodium liver stage parasites. Upper panel: p62 interaction with TRAF6 is essential for MTOR activation and suppression of canonical autophagy (pathway 2). Bottom panel: binding of KEAP1 to phosphorylated p62 increases NRF2 activation. NRF2 is stabilized and translocates into the nucleus to induce the expression of cytoprotective genes that benefit Plasmodium (see text for description). INF-γ: interferon-gamma, PLP1: perforin-like protein 1 (also called SPECT2), PV: parasitophorous vacuole, TV: transient vacuole, PVM: parasitophorous vacuole membrane, TVN: tubovesicular network. Created with BioRender.com.