Figures & data
Figure 1 – NCT-504 reduces the abundance of full length mHTT and Tau. (A) Western blot and quantification of mHTT and HTT levels in primary MEF cells treated either with DMSO (0) or with NCT-504 at the indicated concentrations over 12 hours. N=7. (B) Immunofluorescence images and quantification of mean HTT intensity per cell in primary HDQ200 MEF cells, normalized to DMSO treated samples. N=3 with a total of 213 cells for DMSO treatment and 181 cells for NCT-504 treatment. (C) Western blot and quantification of Tau-GFP levels in DAOY Tau-GFP cells treated either with DMSO (0) or with NCT-504 at the indicated concentrations over 12 hours. N=6. For A and C, mean ± SD. One-way ANOVA used for statistical significance. (D) Immunofluorescence images and quantification of mean Tau-GFP or anti-Tau antibody staining intensities per cell, normalized to dsRed fluorescence and DMSO treated samples. 3 repeats with a total of 132 cells for DMSO treatment and 122 cells for NCT-504 treatment. For B and D, mean ± SEM. Unpaired, two-tailed t test used for statistical significance. (E) Western blot and quantification of Tau-GFP levels in DAOY cells, either mock-transfected or transfected with siRNA targeting PIP4Kγ and treated with either DMSO (-) or 20 µM NCT-504 (+) as indicated. N=6, mean ± SD. Two-way ANOVA used for statistical significance.
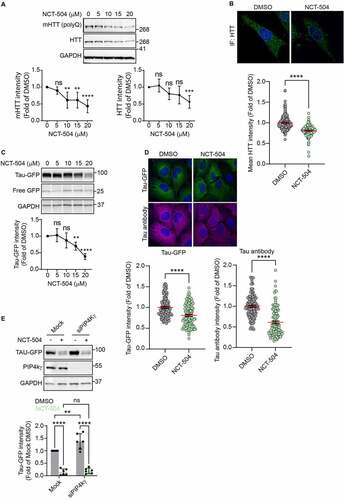
Figure 2 - NCT-504 mediated degradation requires both lysosomal and proteasomal activity. (A) Western blot and quantification of Tau-GFP levels in DAOY Tau-GFP cells treated either with DMSO or E64D (10 µg/ml) and leupeptin (100 µM) for 4 hours, with NCT-504 (20 µM) for 12 hours or with NCT-504 for 12 hours with E64D and leupeptin added for final 4 hours. N=3. (B) Same as A, carried out in primary HDQ200 MEF. N=4. (C) Western blot and quantification of Tau-GFP levels in DAOY Tau-GFP cells treated either with DMSO, with MG-132 (40 µM) for 4 hours, with NCT-504 (20 µM) for 12 hours or with NCT-504 for 12 hours with MG-132 added for final 4 hours. N=5. For A, B and C, mean ± SD. Two-way ANOVA used for statistical significance. (D) Schematic representation of the MAPP assay (E) Western blot and quantification of Tau-GFP levels in cells used for MAPP assay N=3, mean ± SD. Unpaired, two-tailed t test used for statistical significance. (F) Volcano plot representing MAPP assay results with proteins that became more abundant under NCT-504 treatment (blue), proteins that became less abundant (red) and proteins whose abundance did not change (grey), and pie-chart showing protein numbers. N=3 (G) Magnified view of proteins that were less abundant (less degraded) in MAPP under NCT-504 treatment. (H) Magnified view of proteins that were more abundant (more degraded) in MAPP under NCT-504 treatment. Proteasomal subunits circled in light-blue. (I) Quantification of suc-LLVY-AMC assay results over time and comparison of line slopes. N=3 with 3 technical repeats each, mean ± SEM. One-way ANOVA used for statistical analysis.
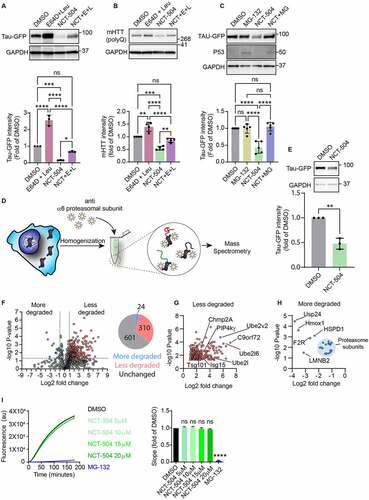
Figure 3 - NCT-504 increases autophagic flux. (A) Fluorescence and quantification of HeLa cells, stably expressing RFP-GFP-LC3 treated either with DMSO for 12 hours, NCT-504 (20 µM) for 12 hours or HBSS for 2 hours. 3 repeats with 92 cells for DMSO, 52 cells for NCT-504 and 63 cells for HBSS treatments. Mean ± SD. One-way ANOVA used for statistical significance. Knockdown of proteins required for autophagy does not inhibit NCT-504 mediated degradation (B) Western blot and quantification of Tau-GFP levels in DAOY cells, infected either with control shRNA (shControl) or with shRNA targeting Atg7 (shAtg7) and treated with either DMSO (-) or 20 µM NCT-504 (+) as indicated. N=3. (C) Western blot and quantification of Tau-GFP levels in DAOY cells, infected either with control shRNA (shControl) or with shRNA targeting Ulk1 (shUlk1) and treated with either DMSO (-) or 20 µM NCT-504 (+) as indicated. N=3. (D) Western blot and quantification of mHTT levels in primary MEF cells, infected either with control shRNA (shControl) or with shRNA targeting Atg7 (shAtg7) and treated with either DMSO (-) or 20 µM NCT-504 (+) as indicated. N=7. For A, B and C, mean ± SD. Two-way ANOVA used for statistical significance.
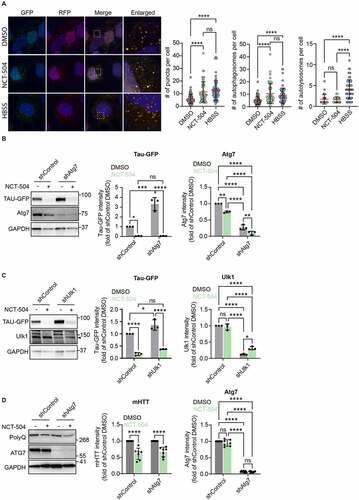
Figure 4 – NCT-504 increases the abundance of endolysosomal organelles. Representative transmission electron microscopy images of primary MEF cells treated either with DMSO (left) or 20 µM NCT-504 (right) and quantification of numbers of autophagosomes, autolysosomes, multivesicular bodies or late endosomes/lysosomes per cytoplasmic area. N=3 with 55 images quantified for DMSO and 77 for NCT-504 treatment. Unpaired, two-tailed t test used for statistical significance. Bar: 2 µm, Expanded bar: 1 µm.
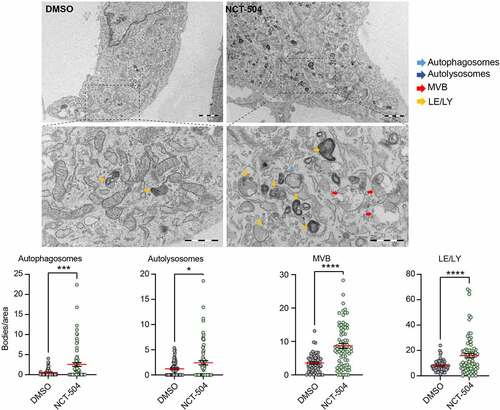
Figure 5 – ESCRT transcripts and ESCRT-mediated degradation are upregulated by NCT-504. (A) Transcriptional levels of ESCRT and associated genes obtained from RNAseq analysis. Upregulated genes are in red, downregulated genes in blue. (B) Immunofluorescence imaging and quantification of primary HDQ200 MEF cells treated either with DMSO or NCT-504 (20 µM) for 12 hours and immuno-stained for LBPA. N=3 repeats with 167 cells for DMSO and 161 cells for NCT-504 treatments. (C) Same as B, performed in DAOY Tau-GFP cells. N=3 repeats with 122 cells for DMSO and 129 cells for NCT-504 treatments. (D) Western blot and quantification of HEK 293 cells treated either with DMSO (-) or 20 µM NCT-504 (+) for 12 hours as indicated and exposed to EGF (+) or left unexposed (-) as indicated. N=6, mean ± SD. Unpaired, two-tailed t test used for statistical significance. (E) Immunofluorescence images of HEK 293 cells treated either with DMSO (-) or 20 µM NCT-504 (+) for 12 hours and exposed to Alexa 555-conjugated EGF. N=3 repeats with 341 cells for DMSO and 300 cells for NCT-504 treatment, mean ± SEM. Unpaired, two-tailed t test used for statistical significance.
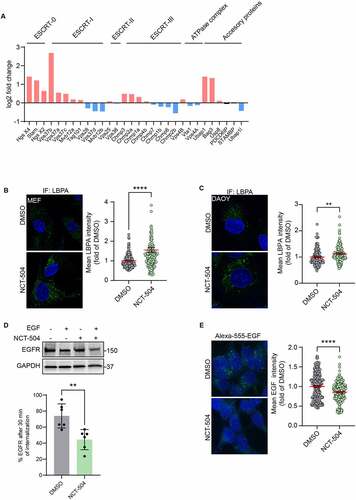
Figure 6 – NCT-504 mediated degradation requires the ESCRT pathway. (A) Western blot and quantification of Tau-GFP levels in DAOY cells, infected either with control shRNA (shControl) or with shRNA targeting Vps4A (shVps4A) and treated with either DMSO (-) or 20 µM NCT-504 (+) for 12 hours. N=6. Mean ± SD. (B) Western blot and quantification of Tau-GFP levels in DAOY cells, infected either with control shRNA (shControl) or with shRNA targeting CHMP4A, CHMP4B and CHMP4C (shCHMP4), treated with either DMSO (-) or 20 µM NCT-504 (+) for 12 hours. Note that only CHMP4A was effectively depleted. N=3, mean ± SD. For A and B, two-way ANOVA used for statistical significance.
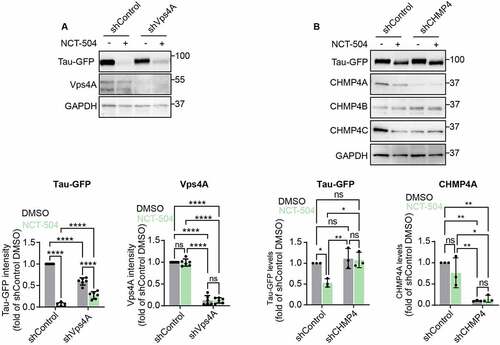
Figure 7 – NCT-504 increases the colocalization of Tau/mHTT with MVB. (A) Western blot and quantification of DAOY Tau-GFP cells infected with either control shRNA (shControl) or with shRNA targeting Vps4A (shVps4A). N=3, mean ± SD. Unpaired, two-tailed t test used for statistical significance. (B) Immunofluorescence imaging and quantification of Tau-GFP DAOY cells infected with either control shRNA (shControl) or with shRNA targeting Vps4A (shVps4A) and treated either with DMSO or 20 µM NCT-504 for 12 hours as indicated. N=3 repeats with 58 cells for shControl DMSO, 43 cells for shVps4A DMSO and 29 cells for shVps4A NCT-504. Mean ± SEM. One-way ANOVA used for statistical significance. (C) Immunofluorescence imaging and quantification of primary HDQ200 MEF cells treated either with DMSO or NCT-504 (20 µM) for 12 hours and immuno-stained for Hrs. N=3 repeats with 207 cells for DMSO and 202 cells for NCT-504 treatments. Mean ± SEM. Unpaired, two-tailed t test used to assess statistical significance.
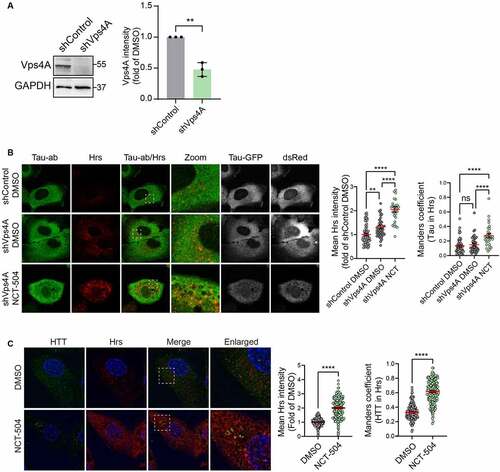
Figure 8 – TFEB depletion increases MVB, accelerates Tau degradation. (A) Fluorescence and quantification of HeLa cells, stably expressing TFEB-GFP treated either with DMSO for 12 hours or with NCT-504 (20 µM) for 12 hours. Quantification shows percentage of TFEB in the nucleus. 3 repeats with 104 cells in each condition. Mean ± SEM. Unpaired, two-tailed t test used for statistical significance. (B) qPCR analysis of TFEB-regulated genes in primary HDQ200 MEF cells treated with 20 µM NCT-504 for 12 hours, compared to DMSO treated cells. N(Beclin1)= 8, N(GABARAP)= 6, N(P62)=6, N(GABARAPL1, UVRAG, LC3B)= 3. Mean ± SD. Unpaired, two-tailed t test used for statistical significance. (C) Volcano plot of TFEB target genes (CLEAR genes) quantified by RNAseq. Upregulated genes are in red, unchanged genes in grey. (D) Western blot and quantification of Tau-GFP levels in DAOY cells, infected either with control shRNA (shControl) or with shRNA targeting TFEB (shTFEB) and treated with either DMSO (-) or 20 µM NCT-504 (+) as indicated. N=3, mean ± SD. Two-way ANOVA used for statistical significance. (E) Western blot and quantification of TFEB-GFP cells in HeLa cells, stably expressing TFEB-GFP treated either with DMSO for 12 hours or with NCT-504 (20 µM) for 12 hours. N=3, mean ± SD. Unpaired, two-tailed t test used for statistical significance. (F) Immunofluorescence imaging and quantification of primary HDQ200 MEF cells infected either with control shRNA (shControl) or with shRNA targeting TFEB (shTFEB) and immuno-stained for LBPA. N=3 repeats with 98 cells for shControl and 99 cells for shTFEB samples. (G) Same as E, performed in DAOY Tau-GFP cells. N=3 repeats with 122 cells for shControl and 68 cells for shTFEB samples. For B-C, Mean ± SEM. Unpaired, two-tailed t test used for statistical significance.
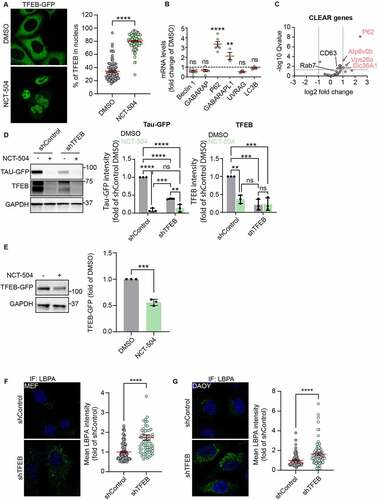
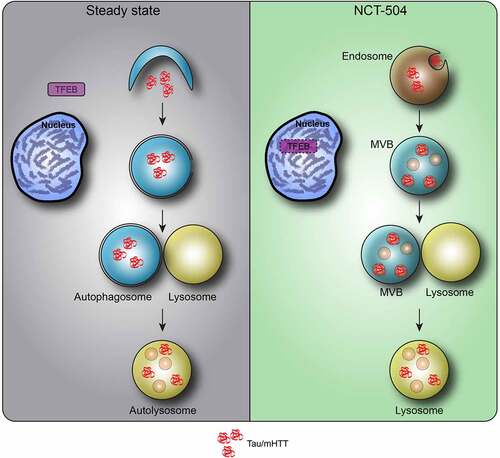
Figure 9 – Model of NCT-504 action. Under steady state, nutrient rich conditions, Tau and mHTT are turned over mainly by autophagy, and TFEB is found in the cytosol. Following NCT-504 treatment, Tau and mHTT are diverted from autophagy and directed to the ESCRT pathway on endosomes and MVB. Intriguingly, NCT-504 treatment results in TFEB translocation to the nucleus, as well as lowered levels of TFEB, and an increase is MVB and lysosomes. A direct causal link between NCT-504 dependent degradation, and NCT-504 dependent TFEB translocation, remains to be tested.