
Figures & data
Figure 1. Timeline of the most relevant milestones in autophagy research in the eye. Each of the ocular tissues are represented by different color boxes. AP: autophagosomes; POS: photoreceptor outer segment; TM: trabecular meshwork; ONT: optic nerve transection; RGC: retinal ganglion cell; BECN1: beclin 1; I/R: ischemia/reperfusion; RPE: retinal pigment epithelium; PR: photoreceptor; HSV-1: Herpes Simple Virus-1; OPTN: optineurin; LACRT: lacritin; RB1CC1: RB1 Inducible Coiled-Coil 1; TBK1: TANK-binding kinase 1; CMA: chaperon-mediated autophagy; OHT: ocular hypertension; RUBCN: RUN domain and cysteine-rich domain containing Beclin 1-interacting protein; ON: optic nerve; AMD: age-related macular degeneration; ULK1: Unc-51 like autophagy activating kinase 1; MYOC: myocilin; EPHA2: EPH receptor A2; PLAAT: phospholipase A and acyltransferase.
Figure 2. General overview of Autophagy. (A) General overview of autophagy pathways. In macroautophagy, a cup-shaped membrane, termed a phagophore, forms and grows to surround a portion of the cytosol. This seals to form an autophagosome that has a double limiting lipid bilayer. The outer membrane of the autophagosome fuses with the lysosome and delivers the inner membrane and its cytosolic components to the lysosome lumen where degradation takes place. In microautophagy, the limiting membrane of the lysosome invaginates, delivering a small internal vesicle containing cytosol to the lumen for degradation. In Chaperone-mediated autophagy, soluble cytosolic proteins are bound by chaperones and directly translocated across the lysosome membrane for degradation. For a more detailed description of the distinct autophagy pathways, the reader is referred to the following references [Citation2-5] (B) Key molecular stages of macroautophagy. (Left panel) Incoming signals, such as inhibition of mTORC1, lead to activation of the ULK1 kinase complex. This in turn phosphorylates the VPS34 lipid kinase complex that produces phosphatidylinositol 3-phosphate (PI3P) at the omegasome. PI3P recruits downstream factors including the WIPIs that help coordinate incoming ATG9 vesicles, in conjunction with ATG2, to transfer lipid to the growing phagophore. (Middle panel) This elongation continues with conjugation of ATG8 proteins to the phagophore. This requires a series of ubiquitin-like conjugation reactions highlighted in the lower section of the middle panel. ATG8s help the phagophore grow and recruit additional autophagy factors including cargo. (Right panel) Once the autophagosome has formed, this is trafficked to lysosome where SNARE-mediated fusion takes place to deliver the cytosolic cargo for degradation.
![Figure 2. General overview of Autophagy. (A) General overview of autophagy pathways. In macroautophagy, a cup-shaped membrane, termed a phagophore, forms and grows to surround a portion of the cytosol. This seals to form an autophagosome that has a double limiting lipid bilayer. The outer membrane of the autophagosome fuses with the lysosome and delivers the inner membrane and its cytosolic components to the lysosome lumen where degradation takes place. In microautophagy, the limiting membrane of the lysosome invaginates, delivering a small internal vesicle containing cytosol to the lumen for degradation. In Chaperone-mediated autophagy, soluble cytosolic proteins are bound by chaperones and directly translocated across the lysosome membrane for degradation. For a more detailed description of the distinct autophagy pathways, the reader is referred to the following references [Citation2-5] (B) Key molecular stages of macroautophagy. (Left panel) Incoming signals, such as inhibition of mTORC1, lead to activation of the ULK1 kinase complex. This in turn phosphorylates the VPS34 lipid kinase complex that produces phosphatidylinositol 3-phosphate (PI3P) at the omegasome. PI3P recruits downstream factors including the WIPIs that help coordinate incoming ATG9 vesicles, in conjunction with ATG2, to transfer lipid to the growing phagophore. (Middle panel) This elongation continues with conjugation of ATG8 proteins to the phagophore. This requires a series of ubiquitin-like conjugation reactions highlighted in the lower section of the middle panel. ATG8s help the phagophore grow and recruit additional autophagy factors including cargo. (Right panel) Once the autophagosome has formed, this is trafficked to lysosome where SNARE-mediated fusion takes place to deliver the cytosolic cargo for degradation.](/cms/asset/366ee990-04e3-4136-b415-156c2dc1d7c8/kauo_a_2178996_f0002_oc.jpg)
Figure 3. Examples of macroautophagy in the eye from adult mito-QC and auto-QC mice. (A) MitoQC tissue sections express a mitochondrially targeted mCherry-GFP transgene that reports on the level of mitophagy (mitochondria in cytosol fluoresce both red and green (overlaps to green-yellow color), while mitochondria delivered to mitolysosomes fluoresce red-only (due to GFP being quenched by the low pH within the autolysosome lumen). Auto-QC tissue sections express a related transgene with the mCherryGFP tag targeted to autophagosomes, which reports on all macroautophagy pathways (green/yellow puncta represent autophagosomes, while red represent autolysosomes). See main body of text for full description. (B) High levels of mitophagy in the retina. Optical section from mito-QC retina (right) or auto-QC retina (center). Boxed regions are shown on the right and arrows highlight examples of mitolysosomes and autolysosomes. RPE, retinal pigment epithelium; OS, outer segment; IS, inner segment; ONL, outer nuclear layer; INL; inner nuclear layer; OPL, outer plexiform layer; IPL, inner plexiform layer; GCL, ganglion cell layer. (C) 3D image projection of the outer retinal region from mitoQC mice. Note hexagonal shape of RPE cells and the significant levels of mitophagy. (D) Z-projection of lens optical slices from the equatorial region of auto-QC mice. Note the high number of autophagosomes (green) and autolysosomes (red). Scale bars, 10 μm. Images are derived from [Citation15] and reproduced under the terms of the Creative Commons Attribution License.
![Figure 3. Examples of macroautophagy in the eye from adult mito-QC and auto-QC mice. (A) MitoQC tissue sections express a mitochondrially targeted mCherry-GFP transgene that reports on the level of mitophagy (mitochondria in cytosol fluoresce both red and green (overlaps to green-yellow color), while mitochondria delivered to mitolysosomes fluoresce red-only (due to GFP being quenched by the low pH within the autolysosome lumen). Auto-QC tissue sections express a related transgene with the mCherryGFP tag targeted to autophagosomes, which reports on all macroautophagy pathways (green/yellow puncta represent autophagosomes, while red represent autolysosomes). See main body of text for full description. (B) High levels of mitophagy in the retina. Optical section from mito-QC retina (right) or auto-QC retina (center). Boxed regions are shown on the right and arrows highlight examples of mitolysosomes and autolysosomes. RPE, retinal pigment epithelium; OS, outer segment; IS, inner segment; ONL, outer nuclear layer; INL; inner nuclear layer; OPL, outer plexiform layer; IPL, inner plexiform layer; GCL, ganglion cell layer. (C) 3D image projection of the outer retinal region from mitoQC mice. Note hexagonal shape of RPE cells and the significant levels of mitophagy. (D) Z-projection of lens optical slices from the equatorial region of auto-QC mice. Note the high number of autophagosomes (green) and autolysosomes (red). Scale bars, 10 μm. Images are derived from [Citation15] and reproduced under the terms of the Creative Commons Attribution License.](/cms/asset/d94e7d4a-0cdd-4f71-83a3-fa9663b3a6e8/kauo_a_2178996_f0003_oc.jpg)
Figure 4. Functions of autophagy-dependent and independent mechanisms in the lens. (A) Schematic presentation of the mammalian lens and the process of programmed organelle degradation in the lens. (B) Functions of autophagy-dependent and PLAAT-dependent pathways in the lens.
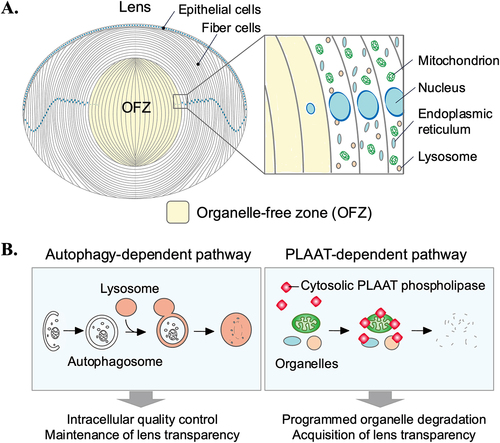
Figure 5. Schematic representations of the roles of stretch-induced autophagy in the outflow pathway. (A) Nuclear translocation of LC3 upon mechanical stretch in TM cells. Under non-stretched control conditions, LC3 is located primarily in the cytosol, shuttling in-and-out of the nucleus. LC3 enters the nucleus by passive diffusion and exits in an XPO1 active-dependent manner. Mechanical stress triggers activation of autophagy and translocation of LC3 to the nucleus. In the nucleus, LC3 is localized in the nucleolus interacting with the autophagy receptor NUFIP1. LC3-NUFIP1 complex is proposed to recognize stretch-induced damaged nuclear proteins and facilitate their export, either via active nuclear transport or nuclear envelope budding, for autophagic degradation in the cytosol. (B) PC-mediated stretched-induced autophagy. PC senses mechanical forces and activate autophagy. Autophagy activation is mediated by the recruitment of ATG16L at the PC basal and is regulated by a cross-talk between AKT1 and SMAD2/3 signaling pathways, acting AKT1 as an inhibitor and SMAD2/3 as an activator.
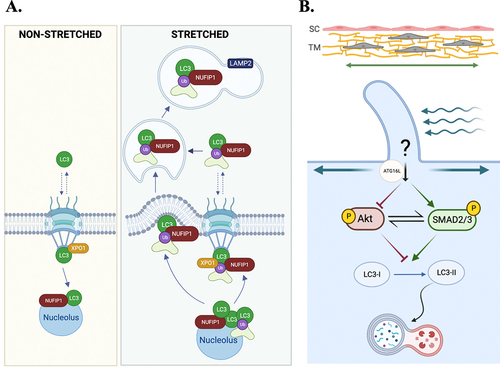
Figure 6. Schematic representation of autophagy in RPE metabolic health and inflammation. (A) Schematic representation depicting the interrelationship between LC3B associated phagocytosis and RPE- fatty acid oxidation. Oxidation of OS derived fatty acids provides B-Hydroxybutyrate (B-HB) and spares glucose for use by the photoreceptor rod cells as depicted. (B) Autophagy deregulation in Cryba1 cKO RPE cells. In the RPE cells, the lysosomal luminal proteinβA3/A1-crystallin (encoded by Cryba1 gene) binds to vATPase and PAT4. Loss of βA3/A1-crystallin specifically in the RPE (Cryba1 cKO mice) leads to increased lysosomal pH, elevated levels of cytosolic amino acids, activation of mTORC1 signaling, decline in TFEB nuclear translocation and CLEAR network gene expression, along with a decrease in basal autophagy, including mitophagy. Further, in the RPE cells from Cryba1 cKO mice and human AMD donors, there is an elevated level of the LCN2 homodimer, a pro-inflammatory adipokine, which unlike its monomeric counterpart, has a higher half-life in the body and is unable to chelate iron. On the other hand, the LCN2 monomer is required for autophagy regulation, as it can form a complex with ATG4BLC3, thereby regulating ATG4B activity and LC3-II lipidation in the RPE cells. However, in the diseased state, the upregulation of the homodimer variant triggers accumulation of iron and subsequent activation of the cGAS/STING-mediated inflammasome pathway. The increased level of the homodimer also blocks the complex formation with ATG4B-LC3, resulting in altered LC3 lipidation and compromised autophagosome processing.
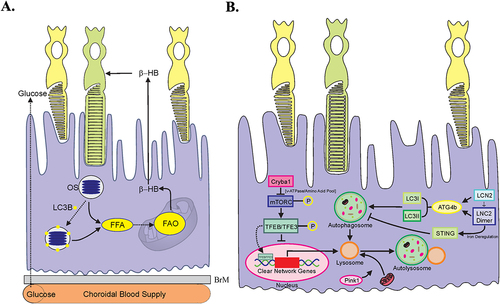
Figure 7. LAP supports the RPE visual cycle. The RPE performs two vital functions that sustain vision, phagocytosis of POS and the visual cycle. Phagocytosis and degradation of POS are supported by a noncanonical form of autophagy termed LAP. In this process, engulfed POS enter the phagosome, followed by the ATG5-dependent recruitment of the lipidated form of LC3. Only then does the lysosome fuse with the phagosome forming the phagolysosome leading to degradation of the POS cargo. The second critical process is the classic retinoid visual cycle that converts vitamin A (all-trans ROL) into the visual chromophore 11-cis-RAL. The visual cycle begins following the absorption of light in the photoreceptors by visual pigments containing the chromophore 11-cis RAL. This generates all-trans ROL (vitamin A) which is transported to the RPE for conversion back to 11-cis RAL by the visual cycle to recharge the visual pigments. Vitamin A is also recovered from the LAP pathway increasing the efficiency of the recovery process. Thus, the important processes of phagocytosis and the visual cycle converge as the recovery of all-trans ROL for 11-cis RAL synthesis in the RPE is aided by the LAP pathway. Blood absorption is also an important source of Vitamin A for vision. RPE, retinal pigment epithelium; PR, photoreceptors; POS, photoreceptor outer segments; 11-cis RAL, 11-cis retinal; All-trans ROL, All-transretinol; L, lysosome.
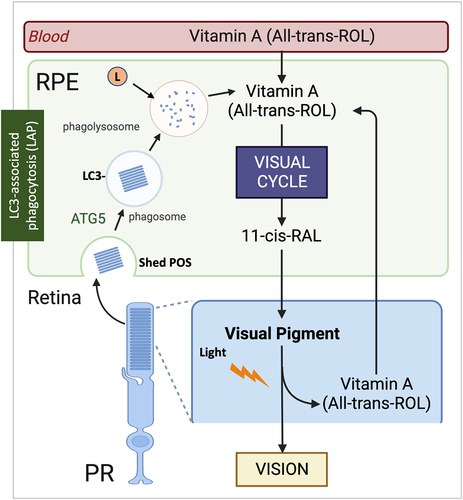
Table 1. Alterations in autophagy-related genes linked to eye diseases
Table 2. Summary of the Proposed Roles of Autophagy in Eye Tissues and Autophagy Status in Disease
Table 3. Major Eye Phenotypes of Mouse Models with Modulated Autophagy Activity